Categories
Self-Hosting

Systemd journal logs: A Game-Changer for DevOps and Developers

“Why bother with it? I let it run in the background and focus on more important DevOps work.” — a random DevOps Engineer at Reddit r/devops

In an era where technology is evolving at breakneck speeds, it’s easy to overlook the tools that are right under our noses. One such underutilized powerhouse is the systemd journal. For many, it’s a mere tool to check the status of systemd service units or to tail the most recent events (journalctl -f). Others who do mainly container work, ignore even its existence.

What is the purpose of systemd-journal?

However, the systemd journal includes very important information. Kernel errors, application crashes, out of memory process kills, storage related anomalies, crucial security intel like ssh or sudo attempts and security audit logs, connection / disconnection errors, network related problems, and a lot more. The system journal is brimming with data that can offer deep insights into the health and security of our systems and still many professional system and devops engineers tend to ignore it.

Of course we use logs management systems, like Loki, Elastic, Splunk, DataDog, etc. But do we really go through the burden to configure our logs pipeline (and accept the additional cost) to push systemd journal logs to them? We usually don’t.

On top of this, what if I told you that there’s an untapped reservoir of potential within the systemd journal? A potential that could revolutionize the way developers, sysadmins, and DevOps professionals approach logging, troubleshooting, and monitoring.

But how does systemd-journal work?

systemd journal isn’t just a logging tool; it’s an intricate system that offers dynamic fields for every log entry. Yes, you read right. Each log line may have its own unique fields, annotating and tagging it with any number of additional name-value pairs (and the value part can be even binary data). This is unlike what most log management systems do. Most of them are optimized for logs that are uniform, like a table, with common fields among all the entries. systemd journal on the other hand, is optimized for managing an arbitrary number of fields on each log entry, without any uniformity. This feature gives this tool amazing power.

Check for example coredumps. systemd developers have annotated all applications crashes with a plethora of information, including environment variables, mount info, process status information, open files, signals, and everything that was available at the time the application crashed.

Now, imagine a world where application developers don’t just log errors, but annotate those logs with rich information: the request path, internal component states, source and destination details, and everything related to identify the exact case and state this log line appeared. How much time such error logging would save? It would be a game-changer, enabling faster troubleshooting, precise error tracking, and efficient service maintenance.

All this power is hidden behind a very cryptic journalctl command. So, at Netdata we decided to reveal this power and make it accessible to everyone.

Try it for yourself in one of our Netdata demo rooms here.

Categories
Self-Hosting

5 DevOps best practices to reinforce with monitoring tools

This blog is contributed to Developer Nation by Netdata

As part of a modern software development team, you’re asked to do a lot. You’re supposed to build faster, release more frequently, crush bugs, and integrate testing suites along the way. You’re supposed to implement and practice a strong DevOps culture, read entire novels about SRE best practices, go agile, or add a bunch of Scrum ceremonies to everyone’s calendar. Every week, the industry recommends that you “shift-left” another part of the DevOps pipeline, to the point where you’re supposed to handle everything from unit testing to production deployment optimization from day one.

While you might have some experience in monitoring software, the reality is that as an aggregate, some others around you probably don’t. According to the Stack Overflow Developer Survey 2020, nearly 40% of developers have less than 5 years of professional experience. There’s not enough time for anyone to learn all these DevOps tools and best practices while also putting meaningful code into a GitHub repository on a regular basis.

Monitoring, and the metrics data it creates, can be a powerful way to encourage DevOps best practices through a common language, and implementing it doesn’t have to be complicated or time-consuming. By combining a DevOps mindset with a “full-stack” monitoring tool, you can start getting instant feedback about the performance and availability of what you’re trying to build—without waiting another 5 years for your team’s DevOps experience to catch up.

If your team has already settled on a monitoring tool, you can start applying these best practices today. If you’re still looking for the right piece of kit, you can start making informed tooling decisions based on what’s going to strengthen your team.

Focus on infrastructure monitoring first

When we talk about monitoring software for DevOps teams, we’re talking primarily about infrastructure monitoring. Infrastructure monitoring is the practice of collecting metrics data about the performance and availability of an application’s “full stack.” That’s everything including the hardware, any virtualized environment, the operating system, and any services (like databases, message queues, or web servers) that might make your application possible.

Depending on the full stack’s complexity, infrastructure monitoring can mean keeping an eye on a single virtual machine (VM) running on Google Cloud Platform (GCP), a Kubernetes (k8s) deployment with dozens of ephemeral nodes that scale horizontally during periods of high usage, or anything in between.

Here’s some key infrastructure metrics to keep an eye on using your monitoring tool (Netdata included):

If you can collect eBPF metrics, that’s even better, even if you aren’t experienced enough to make sense of them yet. eBPF metrics are still very much the cutting edge of infrastructure monitoring, providing extremely granular detail into exactly how the Linux kernel deals with your full stack, so there’s still a lot of flux in recommendations and best practices.

Monitor performance and availability in every environment

Modern DevOps teams should be monitoring the full stack no matter where it runs. This presents quite a large break from tradition, where the operations (Ops) team handled monitoring only once the application was running in production. The perception was that seeing users interact with a full stack was the only way to catch real bugs.

The latest best practices acknowledge that it’s possible—even inevitable—to catch bugs early by monitoring everywhere. That starts with local development servers and extends to any number of testing, staging, or production environments. That also means the monitoring tool should work whether the application is running off the latest M1 Macbook Air or in a multi-cloud deployment across dozens of virtual machines (VMs).

Before you go rushing into your next release process, take time to develop the tooling to monitor in more places. That might mean creating a custom Dockerfile for local development, or adding hooks into your CI/CD toolchain to deploy a fresh staging environment every time a developer reaches a milestone.

How’s this for an easy deployment experience in any environment?

Collect everything, worry about it when you need it

The only way to know that something is going wrong with your application’s infrastructure is to have the data to support it. One common practice is to vacuum up every metric, store it for 2-3 weeks, and have it available if you need to go back in time and root cause an issue or outage.

One way to ensure you’re collecting everything is to choose a tool with high granularity. Every infrastructure monitoring tool collects and visualizes metrics at a specific granularity, which is another way of talking about the time period between one point of collection and the next.

One data point every 60 seconds = low granularity One data point every 1 second = high granularity If you have a transitive-but-critical error that comes and goes within 5 seconds, a low-granularity solution might not even show a blip, which means you still don’t know anything went wrong in the first place.

With low granularity, metrics are averaged out over long periods of time, which has the unwanted effect of flattening what should be a worrying spikes into nothing more than a blip in the noise.

Netdata itself uses an internal time-series database for storing per-second metrics in an efficient way, which gives you tons of flexibility to find the sweet spot between disk space considerations and keeping historical metrics around long enough for proper analysis.

Some DevOps teams even use tools like (e)BPF, which collect and visualize metrics with an event granularity, which means they can show you every event, and not just an average/minimum/maximum of data between two points in time.

Break down silos with metrics

One of the DevOps mindset’s core purposes is to break down existing silos between what used to be separate development (Dev) and operations (Ops) teams. In the past, the Dev team finished writing code, flung across the fence to the Ops team, and wiped their hands clean from whatever came next. The Ops team then spent their days putting out fires and understanding how the application worked.

DevOps is designed to stop this unproductive cycle, but it only works if everyone has access to the same platform and uses the same language: metrics. Choose a tool that’s accessible to everyone who touches application code or controls the production environment. That doesn’t mean having one person who controls the infrastructure monitoring dashboards and lets the rest of the organization look at it in read-only mode.

Make sure your monitoring tool encourages the sharing of information. Let anyone on your team, no matter their role, peek at your configurations or dashboards. By looking over your shoulder, they might learn something valuable, like a metric they’d previously overlooked or a unique troubleshooting strategy. On the other hand, the tool should also let anyone experiment and explore in a “sandbox” that doesn’t affect the core health and availability dashboards.

For example, Netdata Cloud uses the concepts of War Rooms, which are shared containers for DevOps teams who need to do infrastructure monitoring. Every node, alert, and custom dashboard in that War Room is shared between everyone, but each team member can freely create, reconfigure, and learn. No more keys to the dashboarding kingdom, and no more worrying about messing up someone else’s perfectly-crafted troubleshooting experience.

Bubble it up into continuous monitoring

While continuous integration (CI) and continuous delivery (CD; CI/CD) have gotten all the attention, a lot of DevOps practitioners have forgotten about continuous monitoring (CM). This practice helps DevOps teams track, identify, and make decisions from all collected metrics, across all environments, in real time.

While some consider CM the last part of the DevOps pipeline—the practice of monitoring an application in production—other organizations bring CM to the entire CI/CD toolchain, monitoring internal processes and tooling to identify issues before being released into the wild.

With a sophisticated CM strategy in place, your team can better respond to ongoing incidents, with the added benefit of making leaps in the 4 key metrics for DevOps success: mean time to acknowledge (MTTA), mean time to recovery (MTTR), mean time between failures (MTBF), and mean time to failure (MTTF). You’ll improve company-wide visibility into the performance and availability of its stack, and you’ll end up driving real business results, like happier users and improved retention. Because Netdata deploys (easily) everywhere, has highly-granular metrics, and lets users of all experience levels explore and learn their infrastructure, it’s perfect for leveling up a DevOp team with CM.

Don’t have a DevOps monitoring tool yet?

The IT infrastructure monitoring tools that make all these best practices come to life come in a huge variety of shapes and sizes, from open-source toolchains you cobble together on your own to enterprise-friendly monoliths that do everything but cost a ton.

Because there are so many moving parts, a lot of developers and DevOps teams hesitate when choosing an IT monitoring tool, and then end up with something that doesn’t actually empower them, knock down silos between teams, or ramp up the speed of development.

One choice that enables all of the above best practices, and many more, is Netdata. Download the free and open-source Netdata Agent to start implementing DevOps best practices and improve team’s performance know-how with a free, open-source monitoring tool.

Once you’re seeing metrics with per-second granularity, familiarize yourself with Netdata’s documentation and guides to explore more opportunities to explore, troubleshoot, and resolve even the most complex of full-stack issues.

Categories
Self-Hosting

Monitoring vs Observability: Understanding the Differences

This blog is contributed to Developer Nation by Netdata

As systems increasingly shift towards distributed architectures to deliver application services, the roles of monitoring and observability have never been more crucial. Monitoring delivers the situational awareness you need to detect issues, while observability goes a step further, offering the analytical depth to understand the root cause of those issues.

Understanding the nuanced differences between monitoring and observability is crucial for anyone responsible for system health and performance. In dissecting these methodologies, we’ll explore their unique strengths, dive into practical applications, and illuminate how to strategically employ each to enhance operational outcomes.

To set the stage, consider a real-world scenario that many of us have encountered: It’s 3 a.m., and you get an alert that a critical service is down. Traditional monitoring tools may tell you what’s wrong, but they won’t necessarily tell you why it’s happening leaving that part up to you. With observability, the tool enables you to explore your system’s internal state and uncover the root cause in a faster and easier manner.

The Conceptual Framework

Monitoring has its roots in the early days of computing, dating back to mainframes and the first networked systems. The primary objective was straightforward: keep the system up and running. Threshold-based alerts and basic metrics like CPU usage, memory consumption, and disk I/O were the mainstay. These metrics provided a snapshot but often lacked the context needed for debugging complex issues.

Observability, on the other hand, is a relatively new paradigm, inspired by control theory and complex systems theory. It came to prominence with the rise of microservices, container orchestration, and cloud-native technologies. Unlike monitoring, which focuses on known problems, observability is designed to help you understand unknown issues. The concept gained traction as systems became too complex to understand merely through predefined metrics or logs.

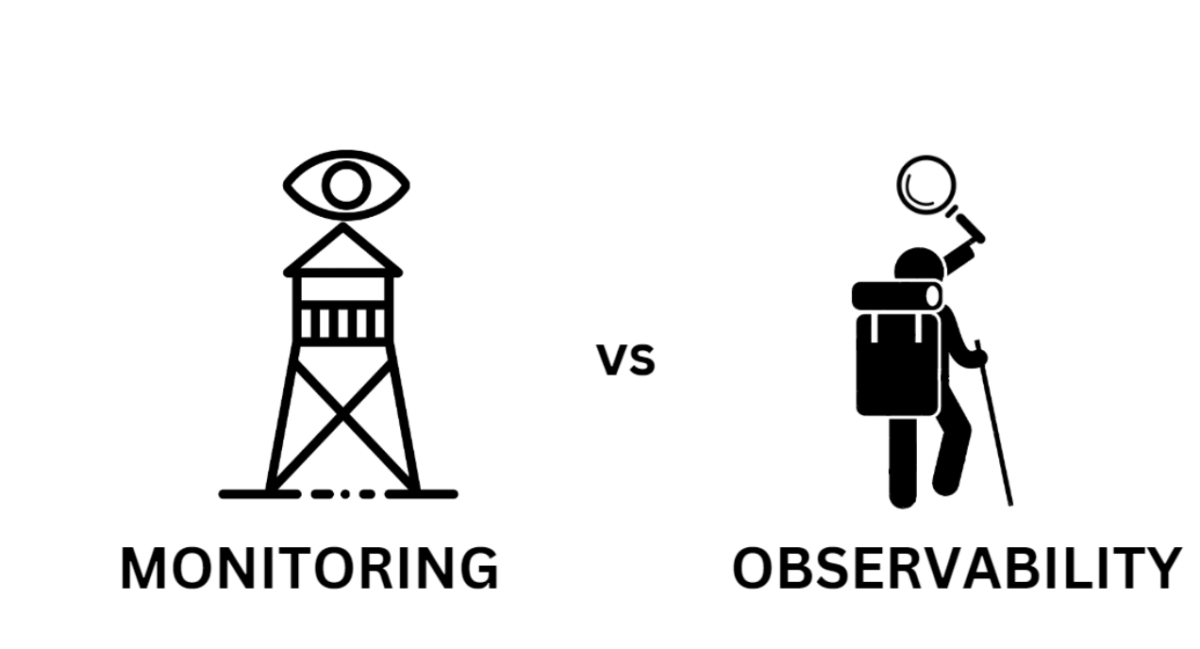
Monitoring: The Watchtower

Monitoring is about gathering data to answer known questions. These questions usually take the form of metrics, alerts, and logs configured ahead of time. In essence, monitoring systems act as a watchtower, constantly scanning for pre-defined conditions and alerting you when something goes awry. The approach is inherently reactive; you set up alerts based on what you think will go wrong and wait.

For instance, you might set an alert for when CPU usage exceeds 90% for a prolonged period. While this gives you valuable information, it doesn’t offer insights into why this event is occurring. Was there a sudden spike in user traffic, or is there an inefficient code loop causing the CPU to max out?

Observability: The Explorer

Observability is a more dynamic concept, focusing on the ability to ask arbitrary questions about your system, especially questions you didn’t know you needed to ask. Think of observability as an explorer equipped with a map, compass, and tools that allow you to discover and navigate unknown territories of your system. With observability, you can dig deeper into high-cardinality data, enabling you to explore the “why” behind the issues.

For example, you may notice that latency has increased for a particular service. Observability tools will allow you to drill down into granular data, like traces or event logs, to identify the root cause, whether it be an inefficient database query, network issues, or something else entirely.

Key Differences between Monitoring & Observability

Data

Monitoring and observability rely heavily on these three fundamental data types: metrics, logs and traces. However the approach taken in collecting, examining and utilizing this data can differ significantly.

Both monitoring and observability rely on data, but the kinds of data they use and how they use it can differ substantially.

Metrics in Monitoring vs Observability

Metrics serve as the backbone of both monitoring and observability, providing numerical data that is collected over time. However, the granularity, flexibility, and usage of these metrics differ substantially between the two paradigms.

Monitoring: Predefined and Aggregate Metrics

In a monitoring setup, metrics are often predefined and tend to be aggregate values, such as averages or sums calculated over a specific time window. These metrics are designed to trigger alerts based on known thresholds. For example, you might track the average CPU usage over a five-minute window and set an alert if it exceeds 90%. While this approach is effective for catching known issues, it lacks the context needed to understand why a problem is occurring.

Observability: High-Fidelity, High-Granularity and Context-Rich Metrics

Observability platforms go beyond merely collecting metrics; they focus on high-granularity, real-time metrics that can be dissected and queried in various ways. Here, you’re not limited to predefined aggregate values. You can explore metrics like request latency at the 99th percentile over a one-second interval or look at the distribution of database query times for a particular set of conditions. This depth allows for a more nuanced understanding of system behavior, enabling you to pinpoint issues down to their root cause.

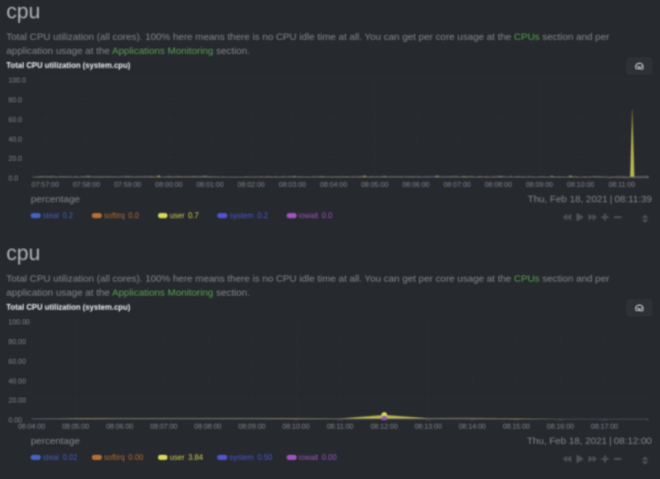
A critical aspect that is often overlooked is the need for real-time, high-fidelity metrics, which are metrics sampled at very high frequencies, often per second. In a system where millions of transactions are happening every minute, a five-minute average could hide critical spikes that may indicate system failure or degradation. Observability platforms are generally better suited to provide this level of granularity than traditional monitoring tools.

Logs: Event-Driven in Monitoring vs Queryable in Observability

Logs provide a detailed account of events and are fundamental to both monitoring and observability. However, the treatment differs.

Monitoring: Event-Driven Logs

In monitoring systems, logs are often used for event-driven alerting. For instance, a log entry indicating an elevated permissions login action might trigger an alert for potential security concerns. These logs are essential but are typically consulted only when an issue has already been flagged by the monitoring system.

Observability: Queryable Logs

In observability platforms, logs are not just passive records; they are queryable data points that can be integrated with metrics and traces for a fuller picture of system behavior. You can dynamically query logs to investigate anomalies in real-time, correlating them with other high-cardinality data to understand the ‘why’ behind an issue.

Proactive vs Reactive

The second key difference lies in how these approaches are generally used to interact with the system.

Monitoring: Set Alerts and React

Monitoring is generally reactive. You set up alerts for known issues, and when those alerts go off, you react. It’s like having a fire alarm; it will notify you when there’s a fire, but it won’t tell you how the fire started, or how to prevent it in the future.

Observability: Continuous Exploration

Observability, by contrast, is more proactive. With an observability platform, you’re not just waiting for things to break. You’re continually exploring your data to understand how your system behaves under different conditions. This allows for more preventive measures and enables engineers to understand the system’s behavior deeply.

Opinionated Dashboards and Charts

Navigating the sprawling landscape of system data can be a daunting task, particularly as systems scale and evolve. Both monitoring and observability tools offer dashboards and charts as a solution to this challenge, but the philosophy and functionality behind them can differ significantly.

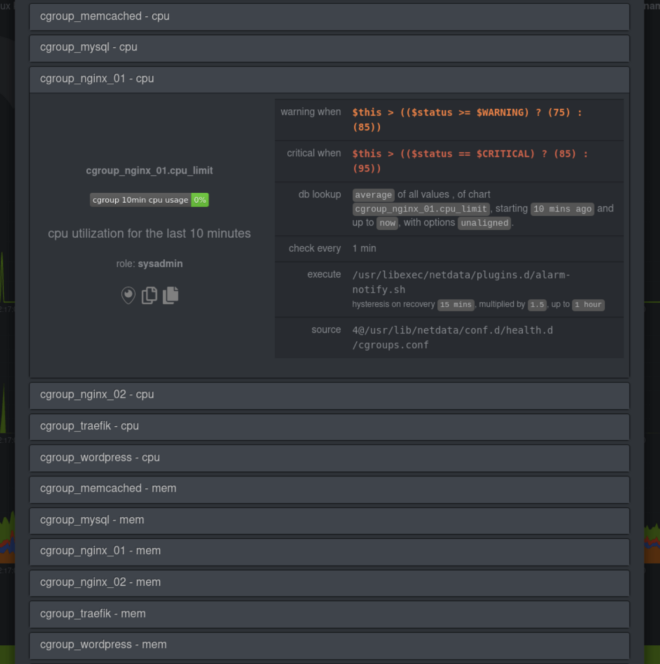
Monitoring: Pre-Built and Prescriptive Dashboards

In the realm of monitoring, dashboards are often pre-built and prescriptive, designed to highlight key performance indicators (KPIs) and metrics that are generally considered important for the majority of use-cases. For instance, a pre-configured dashboard for a database might focus on query performance, CPU usage, and memory consumption. These dashboards serve as a quick way to gauge the health of specific components within your system.

  • Quick Setup: Pre-built dashboards require little to no configuration, making them quick to deploy.
  • Best Practices: These dashboards are often designed based on industry best practices, providing a tried-and-true set of metrics that most organizations should monitor.
  • Lack of Flexibility: Pre-built dashboards are not always tailored to your specific needs and might lack the ability to perform ad-hoc queries or deep dives.
  • Surface-Level Insights: While useful for a quick status check, these dashboards may not provide the contextual data needed to understand the root cause of an issue.

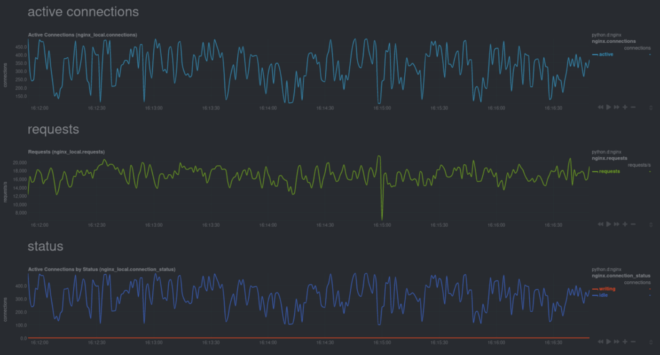
Observability: Customizable and Exploratory Dashboards

Contrastingly, observability platforms often allow for much greater customization and flexibility in dashboard creation. You can build your own dashboards that focus on the metrics most relevant to your specific application or business needs. Moreover, you can create ad-hoc queries to explore your data in real-time.

  • Deep Insights: Custom dashboards allow you to drill down into high-cardinality data, providing nuanced insights that can lead to effective problem-solving.
  • Contextual Understanding: Because you can tailor your dashboard to include a wide range of metrics, logs, and traces, you get a more contextual view of system behavior.
  • Complexity: The flexibility comes at the cost of complexity. Building custom dashboards often requires a deep understanding of the data model and query language of the observability platform.
  • Time-Consuming: Crafting a dashboard that provides valuable insights can be a time-consuming process, especially if you’re starting from scratch.

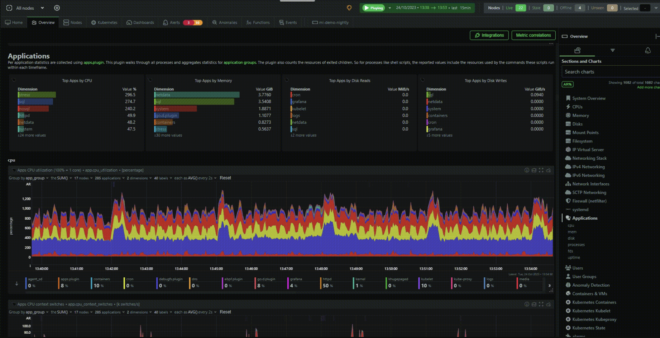
Netdata aims to deliver the best of both worlds by giving you out-of-the-box opinionatedpowerfulflexiblecustomizable dashboards for every single metric.

Real-World Applications: Monitoring vs Observability

Understanding the key differences between monitoring and observability is pivotal, but these concepts are best illustrated through real-world use cases. Below, we delve into some sample scenarios where each approach excels, offering insights into their practical applications.

Network Performance

Monitoring tools are incredibly effective for tracking network performance metrics like latency, packet loss, and throughput. These metrics are often predefined, allowing system administrators to quickly identify issues affecting network reliability. For example, if a VPN connection experiences high packet loss, monitoring tools can trigger an alert, prompting immediate action.

Debugging Microservices

In a microservices architecture, services are loosely coupled but have to work in harmony. When latency spikes in one service, it can be a herculean task to pinpoint the issue. This is where observability shines. By leveraging high-cardinality data and dynamic queries, engineers can dissect interactions between services at a granular level, identifying bottlenecks or failures that are not immediately obvious.

Case Study: Transitioning from Monitoring to Observability

Consider a real-world example of a SaaS company that initially relied solely on monitoring tools. As their application grew in complexity and customer base, they started noticing unexplained latency issues affecting their API. Traditional monitoring tools could indicate that latency had increased but couldn’t offer insights into why it was happening.

The company then transitioned to an observability platform, enabling them to drill down into granular metrics and traces. They discovered that the latency was tied to a specific database query that only became problematic under certain conditions. Using observability, they could identify the issue, fix the inefficient query, and substantially improve their API response times. This transition not only solved their immediate problem but equipped them with the tools to proactively identify and address issues in the future.

Synergy and Evolution: The Future of Monitoring and Observability

The choice between monitoring and observability isn’t binary; often, they can complement each other. Monitoring provides the guardrails that keep your system running smoothly, while observability gives you the tools to understand your system deeply, especially as it grows in complexity.

As we continue to push the boundaries of what’s possible in software development and system architecture, both monitoring and observability paradigms are evolving to meet new challenges and leverage emerging technologies. The sheer volume of data generated by modern systems is often too vast for humans to analyze in real-time. AI and machine learning algorithms can sift through this sea of information to detect anomalies and even predict issues before they occur. For example, machine learning models can be trained to recognize the signs of an impending system failure, such as subtle but unusual patterns in request latency or CPU utilization, allowing for preemptive action.

Monitoring and observability serve distinct but complementary roles in the management of modern software systems. Monitoring provides a reactive approach to known issues, offering immediate alerts for predefined conditions. It excels in areas like network performance and infrastructure health, acting as a first line of defense against system failures. Observability, on the other hand, allows for a more proactive and exploratory interaction with your system. It shines in complex, dynamic environments, enabling teams to understand the ‘why’ behind system behavior, particularly in microservices architectures and real-world debugging scenarios.

Netdata: Real-Time Metrics Meet Deep Insights

Netdata offers capabilities that span both monitoring and observability. It delivers real-time, per-second metrics, making it a powerful resource for those in need of high-fidelity data. Netdata provides out-of-the-box dashboards for every single metric as well as the capability to build custom dashboards, bridging the gap between static monitoring views and the dynamic, exploratory nature of observability. Whether you’re looking to simply keep an eye on key performance indicators or need to dig deep into system behavior, Netdata offers a balanced, versatile solution.

Check out Netdata’s public demo space or sign up today for free, if you haven’t already.

Happy Troubleshooting!

Categories
Self-Hosting

Docker container monitoring with Netdata

This blog is contributed to Developer Nation by Netdata

Properly monitoring the health and performance of Docker containers is an essential skill for solo developers and large teams alike. As your infrastructure grows in complexity, it’s important to streamline every facet of the performance of your apps/services. Plus, it’s essential that the tools you use to make those performance decisions work across teams, and allow for complex scaling architectures.

Netdata does all that, and thanks to our Docker container collector, you can now monitor the health and performance of your Docker containers in real-time.

With Docker container monitoring enabled via cgroups, you get real-time, interactive charts showing key CPU, memory, disk I/O, and networking of entire containers. Plus, you can use other collectors to monitor the specific applications or services running inside Docker containers.

With these per-second metrics at your fingertips, you can get instant notifications about outages, performance hiccups, or excessive resource usage, visually identify the anomaly, and fix the root cause faster.

What is Docker?

Docker is a virtualization platform that helps developers deploy their software in reproducible and isolated packages called containers. These containers have everything the software needs to run properly, including libraries, tools, and their application’s source code or binaries. And because these packages contain everything the application needs, it runs everywhere, isolating problems where code works in testing, but not production.

Docker containers are a popular platform for distributing software via Docker Hub, as we do for Netdata itself. But perhaps more importantly, containers are now being “orchestrated” with programs like Docker Compose, and platforms like Kubernetes and Docker Swarm. DevOps teams also use containers to orchestrate their microservices architectures, making them a fundamental component of scalable deployments.

How Netdata monitors Docker containers

Netdata uses control groups—most often referred to as cgroups—to monitor Docker containers. cgroups is a Linux kernel feature that limits and tracks the resource usage of a collection of processes. When you combine resource limits with process isolation (thanks, namespaces!), you get what we commonly refer to as containers.

Linux uses virtual files, usually placed at /sys/fs/cgroup/, to report the existing containers and their resource usage. Netdata scans these files/directories every few seconds (configurable via check for new cgroups every in netdata.conf) to find added or removed cgroups.

The best part about monitoring Docker containers with Netdata is that it’s zero-configuration. If you have Docker containers running when you install Netdata, it’ll auto-detect them and start monitoring their metrics. If you spin up Docker containers after installing Netdata, restart it with sudo service netdata restart or the appropriate variant for your system, and you’ll be up and running!

Read more about Netdata’s cgroup collector in our documentation.

View many containers at-a-glance

Netdata auto-detects running containers and auto-populates the right-hand menu with their IDs or container names, based on the configuration of your system. This interface is expandable to any number of Docker containers you want to monitor with Netdata, whether it’s 1, 100, or 1,000.

Netdata also uses its meaningful presentation to organize CPU and memory charts into families, so you can quickly understand which containers are using the most CPU, memory, disk I/O, or networking, and begin correlating that with other metrics from your system.

Get alarms when containers go awry

Netdata comes with pre-configured CPU and memory alarms for every running Docker container. Once Netdata auto-detects a Docker container, it initializes three alarms: RAM usage, RAM+swap usage, and CPU utilization for the cgroup. These alarms calculate their usage based on the cgroup limits you set, so they’re completely dynamic to any Docker setup.

You can, of course, edit your health.d/cgroups.conf file to modify the existing alarms or create new ones entirely.

Dive into real-time metrics for containerized apps and services

Netdata’s Docker monitoring doesn’t stop with entire containers—it’s also fully capable of monitoring the apps/services running inside those containers. This way, you’ll get more precise metrics for your mission-critical web servers or databases, plus all the pre-configured alarms that come with that collector!

You can monitor specific metrics for any of the 200+ apps/services like MySQL, Nginx, or Postgres, with little or no configuration on your part. Just set the service up using the recommended method, and Netdata will auto-detect it.

For example, here are some real-time charts for an Nginx web server, running inside of a Docker container, while it’s undergoing a stress test.

Visit our documentation and use the search bar at the top to figure out how to monitor favorite containerized service.

What’s next?

To get started monitoring Docker containers with Netdata, install Netdata on any system running the Docker daemon. Netdata will auto-detect your cgroups and begin monitoring the health and performance of any running Docker containers.

If you already have Netdata installed and want to enable Docker monitoring, restart Netdata using the appropriate command for your system.

Netdata handles ephemeral Docker containers without complaint, so don’t worry about situations where you’re scaling up and down on any given system. As soon as a new container is running, Netdata dynamically attaches all the relevant alarms, and you can see new charts after refreshing the dashboard.

For a more thorough investigation of Netdata’s Docker monitoring capabilities, read our cgroups collector documentation and our Docker Engine documentation. You can also learn about running Netdata inside of a container in your ongoing efforts to containerize everything.