Categories
Business

How to price your app

To matter on the App Store, your app needs to be priced at 99¢, right? Or does it?

Making money from your app is really difficult. Pricing is intuitively an important part of the potential of any app. Price too high, and you price yourself out of the market, but price too low, and you’re leaving preciously needed money on the table.

Michael Jurewitz comes to the rescue! In a five part blog post series, the Apple veteran explains the ins and outs of app pricing, tackling crucial issues like differentiation, pricing power, price elasticity and a practical plan to optimise prices based on your app’s data. Our favorite take-away? Solve a difficult and important problem. Then charge what your software is worth. A must read for every developer who seeks to rise above the app poverty line.

The posts are based on a talk  from the Çingleton and NSConference events.

Michael Jurewitz – Çingleton 2012 from Çingleton on Vimeo.

Categories
Business

How better app quality results in more downloads and revenue

While the link between app quality and app success is quite clear to most developers, it’s always good to throw in some actual data. Happy to oblige.

A very nice visualization of the US iOS App Store over  at App Store Rankings shows that a 4.5-star app gets downloaded on average 3.7x more often than a 3.5-star app (265K downloads versus 71K). Our own research has shown that developers that use performance or user analytics tools to improve their apps generate about 3x as much revenue on average.

Higher revenues for developers using dev tools

The team over at Appurify have added another piece of the puzzle. They analyzed the top 100 free apps in the App Store as of May 2013 to investigate the impact of common performance issues (e.g., crashing, lagging, and slow load times) on app reviews. Analysis components included: number of total reviews; number of “most critical” reviews; number of “most critical” reviews attributable to performance; keyword counts for frequently-occurring descriptors including “crash,” “fail,” “laggy,”  “battery,” and “slow”.  A clear majority of 1-star reviews featured reports of poor app performance.

Likewise, an analysis of 25 million individual app reviews showed that the most frequently-used words in 1-star reviews were mostly tied to poor performance (e.g., work, time, fix) and lacked the positive performance-related descriptors in 5-star reviews (e.g., easy, great, fun).


appurify-analysis
Source: Appurify. Republished with permission.

The action point for developers is clear. Here are some tools that you might use to improve your app’s quality.

[sectors ids=’102,100,106,36′]


Categories
Business

Engagement drives In-App Purchases for games, says Apsalar

Today’s most successful developers are giving their apps away in the app store for free, and, if done correctly, it’s an effective monetization model. At the end of October, of the top 15 grossing apps in the Apple app store, 14 of them are completely free.

This model can be both lucrative (when done correctly) and nerve-wracking, since companies are spending time and resources developing and marketing a product that they subsequently give away for free.

Fortunately for developers thinking about making a game, Apsalar’s Big Data Lab has gathered insights on some 400M unique active devices to help developers make better decisions and figure out what genres of game app developers should be making more of in order to maximize revenue.

For this report, we examined data on millions of in-app purchases. Our goal is to try and inform developers with knowledge on which game categories are most effective at driving in-app purchases and how engagement correlates to purchase events.

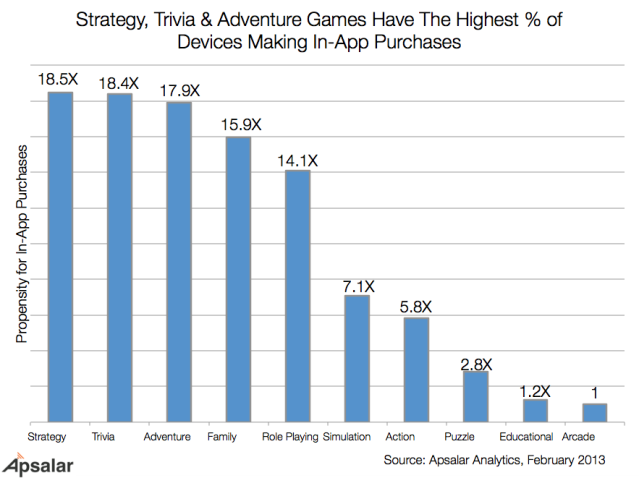
Strategy, Trivia & Adventure most effective at driving IAP

IAP_1

Our data shows Strategy, Trivia, Adventure, Family, and Role Playing games have the highest propensity for in-app purchases. Also noteworthy is the significant drop-off between the top 5 and the bottom 5 categories, as the “Simulation” category has generated about half as many in-app purchases as the “role-playing games” category. One more interesting data point on the above is how low “Action” games rank in terms of in-app purchases. The shift from predominantly casual games on mobile to more hardcore games (i.e., Infinity Blade, Rage of Bahamut, etc.) has driven some companies, who previously pioneered casual games to consider building a hardcore, action game. This data suggests that companies looking to expand beyond casual games should actually consider strategic, role-playing games as viable alternatives.

The next piece of data we looked into was average daily session length by app category. This data shows us how long users have been spending on average per day inside these games.

IAP_2

The sweet spot in terms of engagement is around 2 minutes. Interestingly, while arcade games have an extremely high average daily session length (as seen in the previous graph), they generate a relatively low number of in-app purchases.  One possibility may be that these games actually monetize best not by the freemium model, but by a business model known as paymium. In the paymium model, developers have users download free versions of their games then generate revenue by upgrading their users to, for instance, a $.99 or $2.99 paid product.

Strong correlation between IAP and engagement

The graph below presents a consistent picture between engagement and monetization, except for 2 game categories:

  • Arcade- High engagement with low monetization
  • Trivia- Relatively low engagement with very high monetization

IAP_4

The graph shows almost a straight correlation for all the data points, except for Arcade and Trivia, noted above. Trivia doesn’t appear to be an outlier though. That category generates a healthy level of in-app purchases but is still in a high engagement quadrant. The outlier is Arcade. This category has similar engagement to Trivia, Role-playing and Family (three categories that are high in in-app purchases), yet is at the bottom of in-app purchases.

A key observation is that there is no game category falling in the top left quadrant (i.e. low engagement + high in-app purchases). Which means that game developers have no chance of generating in-app purchases without high engagement.

So the key takeaway for developers using the freemium model is that it’s still critical to first focus on building a great, engaging game in one of the categories where in-app purchases are highest. Once developers have managed to do that and have engaged users, offering in-app purchases such as special items and unique gifts is a great way to take a free app and turn it into meaningful revenue.

This post first appeared on the Apsalar blog.

Categories
Business Tips

How to beat 2/3rds of app competitors

Our mission here at Developer Economics is to help developers create a better app business. A recent survey from App Promo highlights the pain points once again, and offers some hints about the solution.

Let’s start with the bad news…

4 out of 5 developers admit that their app doesn’t make enough money to be considered a standalone business. 2 out of 3 doesn’t break even. This confirms our results from the Developer Economics 2013 report, where 67% of developers who want to earn money live under the App Poverty line (revenues of less than $500 per month).

Despite these disconcerting numbers, and despite developers indicating discovery, making money and turning the app into a business as the main challenges, most developers undervalue the importance of marketing their applications. According to the App Promo survey, 2 out of 3 developers don’t have a marketing budget, and a quarter of developers doesn’t market their app at all.

And yet there is hope. A full 81% of developers said that they would not abandon their app. App Promo found that the survivors (experienced developers with apps that are over 3 years in the market) have succeeded in creating an interesting app business. They report revenues earned to date of over half a million, 100% of them breaks even and 78% considers their app successful enough for a standalone business. And yes, they do market their apps: over half of the respondents in this group has marketing budgets of over $1000 per month.

App Promo’s results also include differences between platforms, the use of various revenue models and marketing techniques, and more. The full results can be downloaded here.

AP_DevThatCould_2

Categories
Languages

Is HTML5 the 3rd horse in the race?

Biggest developer survey

We’re thrilled to announce that the Q2 Developer Economics survey we conducted throughout April was the most successful to date, zooming past the 6,000 respondents mark, making it the biggest developer survey globally.

UPDATE: The survey results have now been published – download the free report here.

We broke through the 6,000 developer mark mainly thanks to the help of our 48 Marketing and Regional partners. Together we reached developers from an unprecedented 115 countries, from mature markets, like the US and Western Europe, to emerging markets, like Brazil, Russia, India and China. To reach developers on a global scale, we translated the survey in 10 languages (Arabic, Chinese, French, German, Japanese, Korean, Portuguese, Russian, Spanish, and Swedish), aided by our local partners, who helped us reach the local dev communities. Thanks to a partnership with Mobile Monday, we also promoted through over 20 local MoMo chapters in Asia and Oceania.

In the next two months we ‘ll be diving into the results of the survey. The Developer Economics state of the developer nation report will be launched in July, as a free download thanks to the sponsorship by BlackBerry, Mozilla, Intel and Telefonica. This 5th incarnation of the Developer Economics report will feature the latest market trends, including Developer Mindshare and Intentshare, platform selection criteria, revenue models, revenues per app and many more. To whet your appetite until the July launch, you can read the previous editions of the Developer Economics report.

To be the first get the Developer Economics 5th Edition report, sign up for our mailing list!

Sneak peek on Mindshare: Android, iOS duopoly entrenched – with HTML closely behind

Our early results from the Q2 app developer survey are starting to come in – starting with the Developer Mindshare Index 2Q13, i.e. the percentage of mobile developers using each app platform.

As you can see in the graph, the use of Android and iOS is still predominant, with a few percentage points of change for both platforms when compared to our 4Q12 survey. You’ll also notice the continued growth of HMTL as the third horse in the platform race, slowly creeping up on iOS. These trends have been steady over the past year – but what do they mean?

Developer Mindshare Index 2Q13

The continued positioning of Android and iOS as the top two platforms is a no-brainer: Android has the largest installed base and iOS enjoys the highest revenue potential overall – so why does HTML5 continue to grow?

HTML5 grows in popularity as large groups of web developers are leaping over the ever-shrinking chasm from desktop to mobile apps. Moreover, HTML5 allows for the development and deployment of apps that work across different platforms, usually at a lower cost of developing HTML apps, and for most app categories. About two thirds of developers targeting HTML mobile develop web sites or web apps while just under a third are using PhoneGap. Stay tuned for more analysis on the route to market for HTML5 apps in the full report.

HTML5 has wide industry backing across telcos, handset makers and platforms (Firefox OS, BlackBerry WebWorks and Tizen) going for it. At the same time, there are certain key disadvantages, namely access to native platform APIs, as well as the lack of a unified development environment and quality debugging tools.

HTML5 is now challenging the duopoly as a development or deployment platform – with the route to market varying across browsers, hybrid apps (e.g. PhoneGap), JavaScript converters (Appcelerator) and dedicated platform frameworks (BlackBerry WebWorks). We still see a growing diversity in the go-to-market approaches for HTML5 developers, and one which we believe will continue to expand. We‘ll be analyzing the HTML vs. native tradeoffs in a future report, but in the meantime – what’s your take on the HTML vs. native debate?

Sneak peek: Windows 8 and BB 10 are gaining traction

As you can see from the early Developer Mindshare graph, Windows 8 and BlackBerry 10 have already attracted a reasonable amount of developer attention. What’s important here is that BlackBerry developers have been quick to migrate from the old legacy (5,6,7) platforms and adopt the latest, BB10 platform.
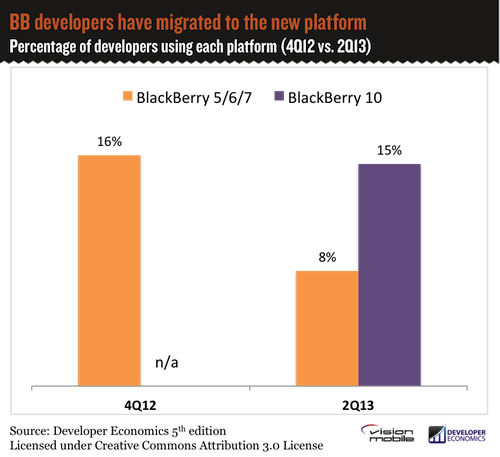
BlackBerry Mindshare

What’s interesting to note in the graph above, comparing the use of BB platforms between the two latest surveys (4Q12 vs. 2Q13) is the fact that the BB 5,6,7 platforms are quickly fading into oblivion, with BB10 mushrooming to a substantial 15% mindshare in just 6 months. The mindshare of BB10 is slightly less than that of BB 5,6,7 six months ago, but the platform is still gaining in strength, as our data for the platforms that developers plan to adopt seem to suggest, so there’s room for growth. The extent to which the new BlackBerry platform can grow in Developer Mindshare depends primarily on the volume of devices that BlackBerry will manage to sell in the coming months, given that reach is the primary reason for platform selection.

Competing against Windows Phone and BlackBerry 10, new entrants Firefox OS and Tizen are slowly gaining support from a few handset OEMs and network operators. Another open question is whether the HTML5 platform proponents – Tizen, Firefox OS and BlackBerry WebWorks – should band together towards a single HTML5 implementation or keep pursuing independent and conflicting strategies. What’s your take?

Full report available in July

We’ll be stopping our sneak peek here – stay tuned for the full report for more (out in July)! There, you’ll find an in-depth analysis of major trends, such as the shifting balance of power between the top platforms, devices vs. tablets, revenue models, as well as the main factors affecting app monetization. If you haven’t already done so, subscribe to our mailing list to receive word of the report publication.

Until next time,
– Matos (@visionmobile)