Categories
Business

The Android Monetisation Myth: iOS still rules the west

[tweetable]Revenues from Android apps saw tremendous growth in 2013[/tweetable]. If you look at the headline global figures then revenues from Android apps on Google Play are rapidly closing on those from iOS apps on the App Store. It looks extremely likely that 2014 is the year that Android will overtake iOS in total app revenues. However, dig a little deeper and you’ll find the distribution of revenues, both geographically and across apps is rather different. If you’re planning your platform strategy for this year then a dive into the details might prove invaluable.

Almost a year ago, I wrote about two important app market trends to watch in 2013, which were continued growth of app revenues (they’re still growing, Android significantly faster than iOS) and revenue distribution (it’s getting even more concentrated at the top). According to Distimo:

“On a typical day in November 2013, we estimate the global revenues for the top 200 grossing apps in the Apple App Store at over $18M. For Google Play, our estimate is about $12M. In November 2012, these estimates were at $15M for the Apple App Store and only at $3.5M for Google Play.

That’s 20% annual growth at the top of the market for iOS and just over 240% annual growth for Android. Add to that there are also alternate stores for Android that have been growing revenues too. These figures and relative growth rates make it seem as if Android is the place to be in 2014. It might be, if you can make it to the very top. If we look at AppAnnie’s report for a similar period, they estimate that total iOS App Store revenues roughly doubled year over year*, while total Google Play revenues were a bit more than triple their year ago levels. So although Apple seems to be improving the revenue distribution slightly, it’s getting even more concentrated at the top of the market on Android.

Even the wider distribution of revenues on iOS may not be quite as good as it looks when we also consider geographic spread. Although the US is still the top revenue earner for iOS, the bulk of the growth is in Asia, particularly China and Japan. The top grossing charts in these countries look very different from the global top grossing apps and this may account for much of the widening range of high revenue apps. [tweetable]On Android, the bulk of the growth and total revenue is in Asia and thus so are the top grossing apps[/tweetable]. Japan has overtaken the US as the top revenue earning country for apps overall mostly due to growth on Android. The vast majority of the increased revenue is in free-to-play games and App Annie’s report shows that in Japan, almost all of this was attributable to just five publishers. Two of those publishers were existing major games powerhouses before the mobile era and they have several well known franchises. Two more reached the kind of scale where TV advertising became a viable route to market and exploded from there. The last of the five is LINE, who built a messaging platform with over 300 million users as a channel to promote their games.

This concentration of revenues amongst five publishers in Japan is mirrored elsewhere in the world. Consider Supercell (makers of Clash of Clans and Hay Day) were at $2.4M per day in revenues in April 2013, when they were still only publishing on iOS (they’ve since launched on Android) and were in the middle of expanding through Asia. That’s more than 10% of daily global App Store revenues for the top 200 grossing apps made by one publisher with 2 apps. Supercell aren’t unique either – according to Think Gaming’s estimates, King.com’s Candy Crush Saga is making more than $900k per day, just on iOS in the US. Indeed Think Gaming give us a better idea of the distribution. Their estimates show that the number 10 grossing game makes only a 10th as much as the top grossing game and by number 100 you’re down to nearly 100th of the revenue.

So, with revenue concentration at the top of the charts on Android even greater than on iOS, Android is the platform to target if you’ve got a world beating app with global appeal on your hands. Otherwise you’re almost certainly still better off on iOS first. Our own data, which considers revenue sources outside the app stores as well, agrees with this. If we only include the publishers earning less than $5M per month then iOS comes out on top, although if we include everyone with non-zero revenues then Android sneaks ahead. Significantly higher revenues for a tiny number of top Android developers pushes the average ahead of iOS (although the median remains way behind – there were more iOS than Android developers earning >$5M per month in our survey).

Android may become the top earning platform from App Stores in 2014 but it seems that only an elite few developers will reap the rewards. We’ve already shown that building enterprise apps and avoiding the app stores is a better bet financially but Android is not currently a lucrative platform in the enterprise market either. Still, it’s not all bad news for Android developers – the rising tide of revenues will lift all boats to some degree. Also, even 2014’s cheap Android device should be running at least Android 4.0 and have hardware capable of running almost any app well. This should reduce costs and increase the real addressable market for all Android developers. Last but not least, for an increasing number of developers [tweetable]it’s not a question of Android or iOS, it’s becoming ever more important to target both[/tweetable].

* Distimo’s year was November to November, while App Annie’s was October to October, so there may be some impacts from the relative timing of new product introductions.

Categories
Languages

How to succeed with HTML5

Although the debate on HTML5 versus native apps seems to be favouring native apps currently, particularly in terms of user experience and performance, average developer revenues tell a very different story. Our survey data shows the mean average revenue for developers who consider HTML5 for mobile devices their primary platform is the highest of all platforms, just over twice that of the next nearest (iOS)*. However, the rewards are very unevenly shared, with the median average revenue for the same developers under half that of their iOS counterparts. Diving into the data we can see significant differences in revenue depending on how mobile apps built with web technologies are delivered to users and the categories they target. Understanding these differences could improve your chances of succeeding with HTML5.

html5

Apps but not App Store sales

The majority of developers using HTML5 in their businesses still prefer to deliver it via the browser, either as traditional websites, or more complex web apps. The range of deployment options for developers using web technology and their relative popularity is shown in the chart below. The data throughout this post is filtered to only include developers whose organisations earn between $1 per month and $5 million per month. There are a large number of hobbyists with no revenue who are excluded and we also exclude a small percentage of super-high earners who create large distortions in the averages.

It turns out this browser-centric preference, despite the protests of the open web advocates, is bad for business – at least in the short term. On average (mean and median) [tweetable]developers deploying their code as standalone apps earn 50% more than those delivering via the browser[/tweetable]. If we exclude apps for platform native web frameworks (e.g. Firefox OS and BlackBerry WebWorks) because these are only available on niche platforms, then the advantage rises to 70% (mean, or 100% median). If we also only look at those developers who consider HTML5 their primary platform then the difference is larger still (mean revenue per person per month of ~$77.5k for app delivery versus $21.5k for browser delivery).

A popular misconception is that the web has poor monetisation and app stores solved this. However, as we’ve shown previously, [tweetable]the more developers rely on app stores for revenue, the less they make[/tweetable]. Web developers are no exception, in fact, avoiding reliance on app store monetisation is one of the keys to their success. Amongst developers using HTML5 for mobile devices as their primary platform who gave us a revenue breakdown, 65% had no revenue at all from app stores and of those that did, a further 65% generated less than 50% of their revenue from app stores. Contrast this with those targeting iOS as their primary platform – 67% of them generate some of their revenue from app stores and for 50% of those it was more than 50% of their total. So where do these web developers make their money? A much wider range of sources – more contract work than most platforms, many more sales outside of app stores and also e-commerce.

The right tool for the job

It’s also clear that HTML5 is not suited for all types of app and while in the case of enterprise clients it seems browser based delivery is still slightly preferred, an app delivery method opens up many more opportunities. The interactive graph below compares revenues by category for browser and app based delivery methods.

Outside the Enterprise software and Maps & Navigation categories, the revenues are at least an order of magnitude higher for app based delivery in this subset of popular categories. The outsized revenues earned by business productivity software developers suggest that the consumerization of IT is making significant inroads into the enterprise and even the comfortable revenues of those who focus on (mobile) browser based delivery for enterprise clients may not last.

Although we shouldn’t underestimate the impact that the relative maturity of many web businesses versus native mobile competitors has on the above figures, web technology seems very far from dead as a way to capture value in the mobile software market. Our data does suggest that those who want thrive in the age of mobile should embrace the consumer preference for apps rather than rely purely on the browser to deliver their services.

– Mark

A brief note on the figures presented in the article:

* Calculated as a mean revenue per person involved in app development and excluding organisations with $0 revenue per month or more than $5 million revenue per month. This is attempting to narrow our inquiry to real app businesses rather than hobbyist developers whilst excluding a small number of outliers that distort the averages. As such this is not comparable with our published reports based on market size estimates for all developers, including hobbyists, students etc. Average revenues on iOS are still the highest if we include all developers.

Categories
Business

Are you using the right app revenue model?

The most popular revenue models appear to be those that are easiest to implement. The developers using them tend to have lower revenues. This may be due to greater competition or it might just be a result of less sophisticated app businesses producing less valuable apps. There are some interesting differences between platforms but [tweetable]subscriptions appear to be a relatively untapped gold mine everywhere[/tweetable], although maybe not for everyone.

VMMoneyNote2_800

Revenue models versus average revenues

Our research shows some significant variation in average developer revenues depending upon the revenue models being employed. An investigation of the relative popularity of revenue models versus revenue generated across the major platforms produces some useful input for app development strategy and planning. Unsurprisingly, the simplest revenue models to implement, like paid downloads and in-app advertising, tend to be the most popular. The often repeated stereotype that “Android users don’t pay for apps” also leads to a strong preference for ad-supported apps on Android, while iOS developers prefer paid downloads. Slightly more surprising is that although Android has a larger user base who seem less inclined to pay up front for their apps, freemium and other in-app purchase schemes are less popular than on iOS. It would seem that on average [tweetable]iOS developers are more sophisticated in their approach to the app business[/tweetable].

Revenue distribution

When considering revenues it’s important to note that the distribution of revenues in the app business is highly concentrated at the top and there are a lot of hobbyists who earn nothing. We exclude most hobbyists, those who’ve not started earning revenue yet, the mega-rich chart toppers and large publishers from our analysis by only counting developers with between $1 per month and $5 million per month in revenues here. Even so, there is a fairly large “middle class” of smaller independent developers with a lot of users and high revenues. As such there’s a massive difference between mean and median revenues even in this subset.

The revenues shown in the chart above don’t necessarily all come from the platform or revenue model they are linked to – [tweetable]developers use multiple revenue models and multiple platforms[/tweetable]. For example, amongst developers who target iOS first the in-app advertising model appears to do much better than for those who target Android. Although iOS advertising rates are higher, this isn’t the primary cause, since very few of our iOS respondents derived most of their revenue from ads. The actual reason is that many of those using ads also used a freemium upgrade model (presumably paying to remove the ads and possibly add features) and derived a significant fraction of their revenue from that also. The same strategy does not appear to work as well on Android. Although not entirely accurate, we’ll refer to revenues by platform and revenue model as a shorthand in the rest of this post because it’s a reasonable approximation in most cases.

Less popular, more people, more revenue

Interpretation caveats aside, one thing that seems clear from this data is: [tweetable]the more popular the revenue model, the less successful the developers using it[/tweetable]. The exception here is contract work, which shows much higher revenues on iOS and lower on Android relative to its popularity. Although there’s some evidence that contract development rates for iOS are slightly higher, the difference is mostly due to where the platforms are most popular with developers. Otherwise, most revenue models show slightly higher mean revenues on Android but significantly lower median revenues. There’s also a link between the average number of people involved in app development in an organisation and the revenue model. More people involved, may signal more complex development for the associated apps. The fact that this is also associated with increased revenue is possibly related to using the extra development complexity (or team size) on a more sophisticated revenue model. It is not the case that more people involved results in higher average revenues per person in general. In fact, there is a very strong peak in mean revenue per person for organisations with 6-10 people involved in development – there are probably some significant efficiency losses above this size.

The subscriptions gold mine

Across both Android and iOS, [tweetable]subscriptions generate by far the highest mean revenues[/tweetable]. Median revenues for subscriptions are also higher than every revenue model except contract development. At the same time, only just over 10% of developers use a subscription model and the average number of people involved is lower than for all but the simplest revenue models. Mean monthly subscription revenues for Android-first developers are 3 times higher than for their iOS-first counterparts. It seems that Android users not paying doesn’t apply to subscriptions. However, median monthly subscription revenues on Android are less than half those on iOS, so there are a smaller number of very big winners with Android-first subscription businesses.

Should more developers be trying to build subscription-based businesses? Almost certainly yes, but they’re not for everyone. While 53% of developers using the paid download model and 45% of those using in-app advertising are in 1-person companies, that’s only the case for 20% of subscription businesses. In fact 53% of the subscription businesses in our survey had more than 5 people, not all of which are directly involved in app development. This is because many popular subscriptions include continuously updated content and there’s significantly more work (and cost) involved in providing ongoing content for subscribers. Our survey has also shown that money is not a primary motivator for lots of developers and managing the content side of the business may not be something they’d want to be involved with. For entrepreneurs looking to build successful app businesses, the subscription model is definitely worthy of further investigation.

– Mark

Categories
Business

App monetisation: Games vs. Enterprise and Business Apps

The mobile apps business is maturing and while most of the media attention is still focussed on the latest app store success stories, developers are finding lots of better ways to improve app monetisation. Considering all revenue sources, which categories of application are generating the most money and what’s the competition like on each platform?

DE12c3_web

App Stores not the answer?

In our last developer economics survey we asked developers to give us a breakdown of their revenue from different sources. Of the 1,695 developers earning between $1/month and $5 million/month who reported their revenue breakdown to us, 55% generated some of their income from app stores. There is a negative correlation between the fraction of revenue an organisation earns from app stores and the total revenue they earn per person involved in app development. That is, the more you rely on app stores for revenue, the less you are likely to make any. By excluding those with revenues above $5 million/month, we’re ignoring the very top of the store charts where the bulk of app store revenue is made. However, this is just a handful of developers, who would otherwise have an extremely disproportionate effect on the average. It’s also worth noting that [tweetable]there are limited costs involved in app store publishing but it produces the lowest average revenues of all sources[/tweetable] in our survey – it’s clearly not the easiest way to build a profitable app business.

Is there gold anywhere but games?

With games accounting for around 75-80% of all app store revenues it’s possibly not surprising that they were the most popular category of app amongst the developers in our survey. Given the chart above it shouldn’t be surprising that they are far from the most profitable (~$2,500/person/month more than the lowest mean income and the lowest overall median income). So [tweetable]which were the most profitable app categories? Business Productivity and Enterprise apps[/tweetable]. However, there are some significant differences between platforms so it’s worth playing with the interactive chart below to spot any opportunities that might be of interest.

[tweetable]Median developer revenues are higher on iOS than Android across all categories[/tweetable], but in some categories mean revenues are higher on Android. This shows that there are some developers managing to exploit the much larger market on Android successfully but most developers are still financially better off on iOS, including revenues from outside the app stores. Where average revenues across all platforms were higher than either iOS or Android, web developers were usually making the most revenue in that category.

The averages in the charts above still hide a lot of potentially interesting detail on where the best opportunities in the apps market are. Those wanting a more complete analysis should look at our App Economy Forecasts report.

Categories
Business Tips

How to beat 2/3rds of app competitors

Our mission here at Developer Economics is to help developers create a better app business. A recent survey from App Promo highlights the pain points once again, and offers some hints about the solution.

Let’s start with the bad news…

4 out of 5 developers admit that their app doesn’t make enough money to be considered a standalone business. 2 out of 3 doesn’t break even. This confirms our results from the Developer Economics 2013 report, where 67% of developers who want to earn money live under the App Poverty line (revenues of less than $500 per month).

Despite these disconcerting numbers, and despite developers indicating discovery, making money and turning the app into a business as the main challenges, most developers undervalue the importance of marketing their applications. According to the App Promo survey, 2 out of 3 developers don’t have a marketing budget, and a quarter of developers doesn’t market their app at all.

And yet there is hope. A full 81% of developers said that they would not abandon their app. App Promo found that the survivors (experienced developers with apps that are over 3 years in the market) have succeeded in creating an interesting app business. They report revenues earned to date of over half a million, 100% of them breaks even and 78% considers their app successful enough for a standalone business. And yes, they do market their apps: over half of the respondents in this group has marketing budgets of over $1000 per month.

App Promo’s results also include differences between platforms, the use of various revenue models and marketing techniques, and more. The full results can be downloaded here.

AP_DevThatCould_2

Categories
APIs Tools

Which apps make more money? App monetization insight from our Developer Economics 2013 report

[This post by Andreas Pappas, Senior Analyst at VisionMobile, first appeared on the VisionMobile blog on April 3, 2013.]

[How do app developer revenues vary by country, or platform? Does the number of platforms make a difference to app revenues? Which models bring in the most revenues? We revisit Andreas Pappas’ November analysis of app monetisation with more insights from our Developer Economics 2013 survey across 3,400+ developers – while launching our latest survey, which is available here]

Developer-Economics-volume-5

Back in November, we looked at which apps make money based on research on how app revenues vary by platform, app category, country and more. In this article we update our analysis on app monetisation based on the latest research from Developer Economics 2013 across 3,400+ app developers, including analysis that did not make it into the report.

We ‘re also proud to launch our very latest Developer Economics survey, which reaches across thousands of app developers and provides the data for our famous state of the developer nation reports. Thanks to the sponsorship by BlackBerry, Mozilla, Intel and Telefonica it possible to provide these reports and additional insights, for free, to the entire mobile community.

Take part in the survey, spread the word and help us drill deeper into the app economy and what makes it tick. We have prizes aplenty for developers, with 7 devices up for grabs (one iPhone 5, two Samsung Galaxy SIII, two Nokia Lumia 920 devices and two BlackBerry Dev Alpha handsets) – plus an AR Drone 2.0, a Nest Learning Thermostat and a Nike Fuel Band for participants who also subscribe to our developer panel. Last, but definitely not least, our friends at Bugsense are giving away one month of free crash reporting to each and every participant.

Survey Q1 2013


Developers in North America lead the revenue leaderboard

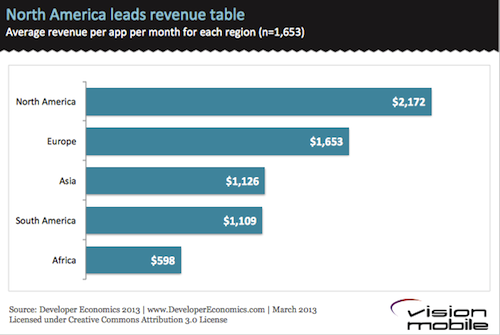
We’ll start by taking a look at income distribution by the region where app developers are based. Last time we saw that US developers earned almost double the revenue of UK developers. Based on our Developer Economics 2013 data, North America (and particularly the US) is still in the driving seat of the mobile app economy with developers in North America generating about 30% more than their european counterparts, who in turn generate 47% more revenue than developers in Asia. To some extent higher revenues for NA developers are explained by higher consumer spending in the US and higher penetration of iOS, which as we will see later on, still generates higher revenues than other mobile platforms. Note that across this analysis we are restricting our sample to mobile app developers, and have excluded the top 5% of revenue earners in order to minimise the effect of outliers.

North America leads app revenue leaderboard

While app development activity is booming in Asia, the average app-month revenue is quite lower than in the US and Europe, although developers in Asia develop, on average more apps and use more mobile platforms. As we explained in the previous article, there are multiple reasons for this revenue gap, but the prevailing reason is the fact that paid apps are not popular in most of Asia, the country that drives the Asian app economy. Instead, developers in Asia rely much more on advertising revenue, which, according to our findings is the least profitable revenue model.

iOS still monetising better than other platforms

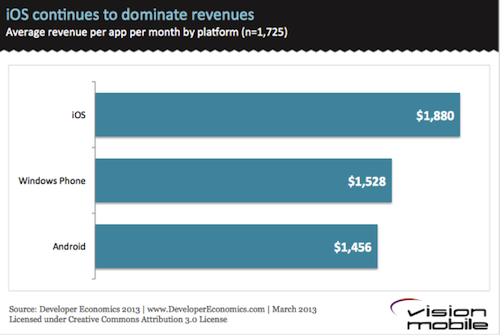
iOS continues to dominate platform revenues, generating, on average, 30% more revenue per app-month than Android. The revenue gap has reduced by 5 percentage points compared to that reported in our Developer Economics 2012 report in June 2012.

iOS continues to dominate revenues

At the same time, Windows Phone has caught up with Android and seems to be doing slightly better. Although the 5% advantage is arguably within the margin of error, Windows Phone has significantly improved its position relative to the figures reported in the Developer Economics 2012 survey, when it generated, on average, about half as much revenue as Android. How has the landscape of platform monetisation changed in Q2 2013? Join the survey and help us track the state of the developer nation.

Multi-platform developers earn more

Developers using more platforms earn more

There is a wide revenue gap between developers/publishers using 6+ platforms and those using 5 or fewer platforms, with those developing for 6+ platforms generating, on average, 75% more revenue. However, only a small part of the developer population (4%) develops on 6+ mobile platforms; these are probably established services with a large footprint that want to ensure that their apps are universally available (e.g. Facebook, Skype etc.) or large software houses with a large enough pool of resources to target multiple platforms for their customers.

Those developers employing just one platform are probably solo, amateur developers or have not yet had the success that warrants (and allows) an expansion onto more platforms. As developers become more successful, they will expand onto new platforms and generate more revenue. So while, expanding on more platforms is not sufficient to generate more revenue on its own, those that do find success are likely to invest in a multi-platform strategy.

Extending apps to new markets is a profitable strategy

We asked app developers how they decided on which apps to develop or work on next and then looked at the way revenues vary depending on their strategy. While most developers will develop apps they want to use themselves (50%), this is apparently the least successful strategy and should not become the sole deciding factor for your next app.

Extending apps into new markets pays better

Developers that use some form of market research such as discussing with users, monitoring apps stores or directly buying market research are much better off, generating at least double the revenue of those who just develop the apps they want to use. However, market research is not widely used among the developer population: only 24% of developers discusses with users, highlighting a lack of business maturity and also a gap in frictionless 2-way communication channel between developers and users.

Overall, the most successful developers are those that extend apps to new markets, either to new geographies or different verticals. To some extent, these strategies rely on copying the recipe of an already established and successful business: these are apps that have been tried and proven in at least one market and are generally less risky options or “low hanging fruit” for developers. Why start from the ground up when you can stand on the shoulders of giants?

The most lucrative revenue models are off limits for most developers

When talking app monetisation, there are over 10 different revenue models to chose from. Device royalties and distribution licensing fees are the top-grossing models but are quite rare among app developers due to their high barriers to entry. These models imply deals with device manufacturers and distributors which means long, expensive sales cycles and a successful app to start with. Among the rest of the revenue models, commissioned apps (development for hire) come on top since they come with a low risk and guaranteed income for developers that work under contract.

Royalties & licencing fees pay better

The next most lucrative revenue model is the subscription-based model but this also comes with caveats: a subscription service implies a significant investment in licensing, and maintaining quality content or services that keeps users engaged on an ongoing basis.

Among the revenue models that are most popular and more accessible to developers, In-app purchases come on top, generating, on average 34% more revenue than Freemium and 43% more revenue than Pay-per-download. In-app purchases and Freemium models are becoming increasingly popular, now being used by a quarter of developers as they seem to be appealing to consumers. We ‘re revisiting the topic of most lucrative revenue models in our latest survey. Join in and help us size the app economy.

Smart developers use smart tools

Finally, we take a look at how developer revenues correlate to the use of third party tools and services. It’s interesting to see how app revenues correlate with usage of performance tracking and management tools like user analytics and crash reporting. Developers using crash reporting and bug-tracking tools such as Crittercism or BugSense generate on average, three times more revenue than developers who don’t use these. Similarly the usage of User Analytics (e.g. Flurry, Apsalar) services is also associated with much higher revenues, with those using user analytics services generating 168% more revenue than those who don’t.

Higher revenues for developers using dev tools

Both user analytics and crash reporting services are used by experienced developers who recognise the importance of optimising for user acquisition, activation and retention, while reducing in-the-field crashes and the resulting user churn.

Track the state of the developer nation

[tweet_this content=’App developer? Take the new Developer Economics survey and win prizes!’ url=’ http://www.visionmobile.com/DS13PortalBlog’]These insights are made possible by our ongoing surveys. Join the latest Developer Economics survey to help us draw deeper insights into monetisation, the size of the app economy and the debate of HTML5 vs. native. In this survey we ‘re focusing on the population of iOS, Android, WP, BlackBerry and HTML5 developers, across countries, app categories and developer types. If your are a developer take the survey, or otherwise spread the word and watch this space for an update on revenues, platforms and the state of the developer nation.[/tweet_this]

And don’t forget to fire away with those comments, rants, criticism, praise or simply feedback on what you ‘d like to see next.

Andreas (follow me on twitter @PappasAndreas)

Categories
Business

Revenue Haves and Have Nots

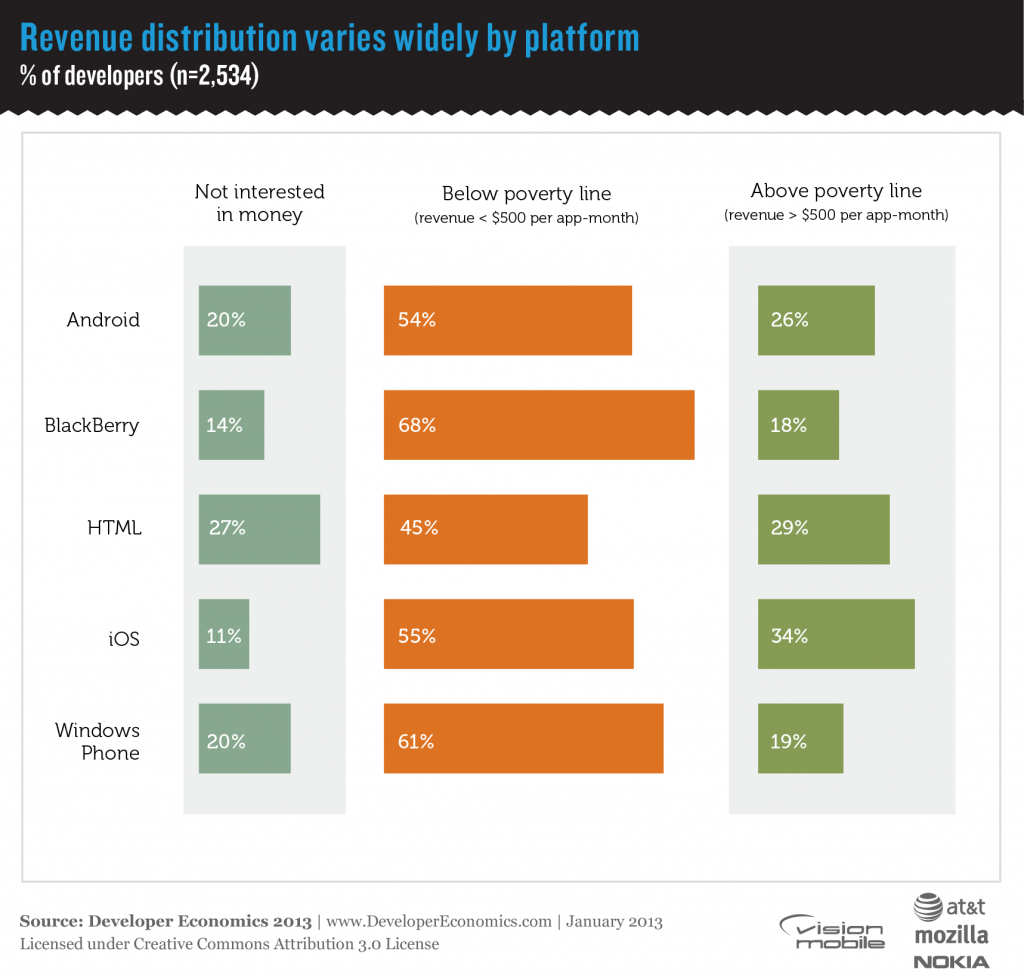
While not all developers are in it for the money, most would like their apps to provide an income and the majority of those struggle to earn revenues that will sustain further development. We defined $500 per app per month as a reasonable global “poverty line”, in some countries this is very low while in others it’s a very good income. It’s also worth noting that many developers have multiple apps in the market so it doesn’t represent total income. As we’ve highlighted previously, the revenue distribution on the app stores is highly skewed toward the top and this is a major issue for the health of developer ecosystems going forward. Some developers may feel that the level of competition on Android and iOS is too high and they are thus tempted to try one of the smaller marketplaces in search of revenues. Our survey says that this is likely to be a mistake, there is indeed a wide variation in revenue distribution by platform, but the smaller markets have an even higher proportion of developers below the poverty line. The reduced competition is more than offset by the smaller user base at present.

Developer Economics 2013 - Revenue distribution by platform

Around 18% of 3,460 respondents in the Developer Economics 2013 survey indicated that they are not interested in making money from apps. Nevertheless, out of the vast majority of developers that are in it for the money, 67% are not making enough to sustain them or their business, i.e. they are below the “app poverty line” of $500 per app per month. For the majority of developers, app development is not financially rewarding.

Overall, less than 1 in 5 Blackberry developers make more than $500 per app-month. The situation is almost as challenging on Windows Phone where just 19% of developers generate more than $500 per app-month, with 61% below the poverty line. The findings of our survey are somewhat better for Android and iOS although these platforms too, are far from a developer paradise: 55% of iOS and 54% of Android developers are below the poverty line. Excluding developers that are not interested in profit, 62% of iOS developers and 67% of Android developers are not making more than $500 per month per app.

HTML seems a surprise here with just 45% of HTML developers under the poverty line, far lower than any other platform. However, there are fundamental differences between HTML and native platforms which are responsible for the differences observed here: developers using HTML for web development have access to a much larger user base comprising desktop and mobile users, irrespective of platform. Among HTML developers, subscription-based revenue models are much more popular than on native platforms pointing to established online content or service businesses that have expanded on to mobile.

[doritos_report location=’DE13 Article – Revenue Distribution’]

Categories
Tools

Cross-Platform Tools – Does it pay to use them?

In our January 2013 Developer Economics Report, we revealed that multi-platform developers are better off. Our survey data also reveals, rather unsurprisingly, that users of cross-platform tools (CPTs) target more platforms than those building separate apps for each platform. Of those interested in making money, users of CPTs target 4.33 platforms (3.1 mobile platforms) on average vs 3.46 platforms (2.57 mobile) for those building separate apps. We also know that the most popular class of CPTs (using web authoring languages) tradeoff app capability to get the increased portability. At the same time, popular opinion on the internet and amongst venture capitalists is that a cross-platform user experience can’t compete with using the platform native frameworks. So how do these tradeoffs translate into revenue for CPT users?

CPT users make more revenue

On average, CPT users make slightly more revenue per app per month than developers not using such tools. With the reduced cost of development provided by the CPT, this suggests that they’re significantly more profitable.

Averages can be deceiving where the distribution of results is far from normal, as with app revenues, so it’s worth examining the details. App revenue is heavily concentrated at the top end of the market, with a large fraction of the (mean) average coming from a small number of very high earners. If we exclude all developers earning more than $50k per app per month then the result holds – CPT users still generate more revenue.

Not all CPTs are created equal

There are also several different types of CPT. Games have been responsible for close to half of all app revenues (at least those generated directly through app stores) and since they typically don’t require many platform-specific APIs or UI elements, they’re a good candidate for building with cross-platform. This suggests that users of primarily games-centric CPTs like Corona, Unity 3D & Marmalade might be responsible for the out-performance of CPTs, while users of the low development cost tools taking advantage of web authoring languages, such as PhoneGap, Appcelerator, Brightcove & Sencha, generate slightly lower revenues. However the data shows that the opposite is in fact the case.  Users of the games-centric CPTs are generating below average revenue, whilst the web-centric CPT users are significantly better off. These results also hold whether or not we include those earning over $50k per app per month.

A plausible explanation for this is that most of the larger and more successful game developers are managing their own cross-platform compatibility or code re-use whilst many smaller independent game developers relying on 3rd party tooling are struggling with the fierce competition in the games market. At the same time it seems that, when it comes to revenue, a fully native user experience and native performance are not as important as their proponents suggest. The very high earners using web-centric tools are most likely to be existing publishers selling their content through mobile app subscriptions and our revenue estimates are probably too low, since the top income band in our survey is everything over $100k per app per month.

Both ends of the revenue spectrum

For several CPTs in our survey we didn’t have enough respondents to be sure differences in revenues for individual tools are statistically significant, however, there are a couple of individual ones worth highlighting. At the low end, revenues for Qt developers were significantly below average – this probably reflects the fact that Qt does not yet have official support for iOS or Android (planned for this year). At the high end, although we only had a relatively small sample, revenues for Brightcove App Cloud users were more than 3 times the average making the difference statistically significant, whether or not we include those generating over $50k per app per month. Brightcove appear to be focussing their solution on a particularly profitable market segment.

Tool selection – do it for the right reasons

Finally, if you’re looking to select a CPT, make sure you do it for the right reasons. Main selection criteria including access to native APIs and the ability to create a native UI look and feel are correlated with above average revenue, whilst the availability of third party extensions and choice of authoring languages are correlated with below average revenue. The former criteria look to minimise some weaknesses of the cross-platform approach whereas the latter criteria focus on reducing one-off costs. The latter are not necessarily bad reasons for choosing a tool but if they are amongst the most important reasons for your selection then it’s worth re-evaluating priorities. Work out what will enable the creation of the best product at acceptable cost rather than simply minimising cost. If the lowest possible development cost is critical to make the app concept viable then it’s probably time to come up with a higher value concept.

Categories
Business News and Resources

Two Important App Market Trends to Watch in 2013

2012 was another big growth year for the app market. Apple continued to launch new products, sell them in ever greater volumes and distribute more revenue to developers. Meanwhile Google overhauled their market and developer revenues climbed sharply. Android developers also saw the Amazon Appstore expand and become a serious second revenue source. Developers who created quality apps and marketed them well were richly rewarded. However, for many developers the major challenge of getting their apps discovered by users only got worse. How is 2013 likely to compare and what are the most recent app market trends? Will app revenues continue to grow at similar rates and will those revenues keep concentrating in the hands of fewer publishers?

App market trends: Continued Growth

According to Distimo’s 2012 report, Apple’s daily App Store revenue grew 21% in the four months to the end of November. Google Play revenue grew 43% in the same period. During November the average daily revenue from the App Store was $15m while for Google Play it was $3.5m. So Google has more than double the growth rate, although from a much lower base.

The graph below extrapolates those four month growth rates exponentially through 2013. This illustrates the effects if those growth rates continued – this is not a prediction.

The Apple daily revenues and growth rate figures were taken during a double new product introduction spike, so the actual 2013 growth is likely to be significantly lower. According to App Annie, iOS revenue growth for the first 10 months of 2012 was only 12.9% total.

Similarly Android’s revenue growth in 2012 was from a very low base, it will be important to watch how it changes as the absolute revenue levels increase. The likelihood is that Android revenues will be significantly closer to iOS revenues by the end of 2013 but iOS revenues much closer to where they are now than the graph above suggests.

In the biggest spending app markets around the world, smartphone penetration is above 50%. A large proportion of smartphone purchases in those markets in 2013 will therefore be replacement devices running the same platform. With iOS a new device can download purchased content and restore in-app purchases at no extra cost. On Android it’s entirely up to the developer whether existing purchases can be used on a new device but by default, paid apps can be downloaded to new devices and in-app purchases will not be restored automatically without charge.

App revenue expectations

Will users continue to spend on apps at the same rate on replacement devices, or will the app revenues in the most developed markets start to fall? There’s likely to be some variation here across platforms and app categories but this may be the first year that the total market growth doesn’t obscure this important user behaviour trend.

App market trends: Revenue Distribution

Although the app stores are generating millions of dollars in revenues every day, those are not distributed at all evenly amongst developers. Canalys recently highlighted that 50% of revenues are earned by just 25 publishers in the US. Although we already pointed out that this is not as bad as it sounds, since those publishers have well over 1000 apps between them, at the very top, the concentration really is that extreme and getting worse.

According to the 2012 report from Distimo linked above, 7 apps were responsible for 10% of revenues on the iPhone in November, for the iPad it was only 6 apps and on Google Play just 4. At the very top on iOS we know that Supercell were grossing $500k per day from two games in early October. At the time Hay Day, the lower ranked of the two, was below position 20 in the top grossing chart, while it is now rarely outside the top 10. Clash of Clans has consistently been in the top 2 since that report. We can guess their revenue is even higher now and that the number 1 grossing spot is worth somewhere around $300-450k per day (about 2-3% of total iOS revenues) before Apple’s 30% cut.

In January 2012 the top 11 apps for the iPhone were responsible for 10% of revenues while on the iPad it was 8 apps. It’s tempting to speculate that the greater increase in revenue concentration on the iPhone is due to the changes to the App Store in iOS 6. However there is very little overlap between the top 10 grossing apps and the top 10 paid or free downloads. Whatever the reasons for this increased concentration of revenue at the top, this is an important trend to watch in 2013.

If revenues aren’t more evenly distributed amongst a larger number of developers then investment in new app projects must eventually start to decline. Otherwise, developers will need to find more business models that aren’t dependent on direct monetisation of their apps through stores.

If you are interested in more recent trends, have a look into our App Developer Trends from Q1 2015.

Categories
Business Platforms

Multi-Platform Developers Are Better Off

Our latest survey shows a concentration of developer attention around the iOS/Android duopoly. Given the reach and revenues available on the two leading platforms compared to the competition, it’s unlikely that developers will find significant success without targeting one or both of them. However, our survey data also shows that developers should not limit themselves to those two platforms. There is a strong correlation between average revenue and the number of platforms targeted.

Developer Economics 2013 - Multi-platform developers generate higher revenues

74% of developers use two or more platforms concurrently. At the same time, developer platform choices are now narrowing. On average mobile developers use 2.6 mobile platforms in our latest research, compared to 2.7 in 2012 and 3.2 in our 2011 research. The Android-iOS duopoly in smartphone sales is gradually creating a concentration of developers around these two platforms: 80% of respondents in our sample develop for Android, iOS or both, making them the baseline in any platform mix. Developers that do not develop for one of these two platforms generate, on average, half the revenue of those developers that do, leaving little doubt as to the concentration of power within these two major ecosystems.

In our Developer Economics 2013 survey of over 3,400 developers we found that 49% of developers use just one or two mobile platforms concurrently and 75% use up to three mobile platforms. The number of platforms developers use depends to some extent on which is their lead platform. In mobile development, loyalty to one platform is not something that pays off. Our research shows that the revenues are higher when using more platforms. For example, an iOS developer porting an app on Android is likely to experience some growth in revenue. At the same time, for developers working on four or more platforms, higher revenues are probably the result of extending an already successful app to more platforms. Obviously, this is not something that all developers can afford to do; it is a strategy more suited to large publishers or commissioned developer teams that are large enough to support a number of platforms.
[doritos_report location=’DE13 Article – Mulit-Platform’]