Categories
Business

Are you using the right app revenue model?

The most popular revenue models appear to be those that are easiest to implement. The developers using them tend to have lower revenues. This may be due to greater competition or it might just be a result of less sophisticated app businesses producing less valuable apps. There are some interesting differences between platforms but [tweetable]subscriptions appear to be a relatively untapped gold mine everywhere[/tweetable], although maybe not for everyone.

VMMoneyNote2_800

Revenue models versus average revenues

Our research shows some significant variation in average developer revenues depending upon the revenue models being employed. An investigation of the relative popularity of revenue models versus revenue generated across the major platforms produces some useful input for app development strategy and planning. Unsurprisingly, the simplest revenue models to implement, like paid downloads and in-app advertising, tend to be the most popular. The often repeated stereotype that “Android users don’t pay for apps” also leads to a strong preference for ad-supported apps on Android, while iOS developers prefer paid downloads. Slightly more surprising is that although Android has a larger user base who seem less inclined to pay up front for their apps, freemium and other in-app purchase schemes are less popular than on iOS. It would seem that on average [tweetable]iOS developers are more sophisticated in their approach to the app business[/tweetable].

Revenue distribution

When considering revenues it’s important to note that the distribution of revenues in the app business is highly concentrated at the top and there are a lot of hobbyists who earn nothing. We exclude most hobbyists, those who’ve not started earning revenue yet, the mega-rich chart toppers and large publishers from our analysis by only counting developers with between $1 per month and $5 million per month in revenues here. Even so, there is a fairly large “middle class” of smaller independent developers with a lot of users and high revenues. As such there’s a massive difference between mean and median revenues even in this subset.

The revenues shown in the chart above don’t necessarily all come from the platform or revenue model they are linked to – [tweetable]developers use multiple revenue models and multiple platforms[/tweetable]. For example, amongst developers who target iOS first the in-app advertising model appears to do much better than for those who target Android. Although iOS advertising rates are higher, this isn’t the primary cause, since very few of our iOS respondents derived most of their revenue from ads. The actual reason is that many of those using ads also used a freemium upgrade model (presumably paying to remove the ads and possibly add features) and derived a significant fraction of their revenue from that also. The same strategy does not appear to work as well on Android. Although not entirely accurate, we’ll refer to revenues by platform and revenue model as a shorthand in the rest of this post because it’s a reasonable approximation in most cases.

Less popular, more people, more revenue

Interpretation caveats aside, one thing that seems clear from this data is: [tweetable]the more popular the revenue model, the less successful the developers using it[/tweetable]. The exception here is contract work, which shows much higher revenues on iOS and lower on Android relative to its popularity. Although there’s some evidence that contract development rates for iOS are slightly higher, the difference is mostly due to where the platforms are most popular with developers. Otherwise, most revenue models show slightly higher mean revenues on Android but significantly lower median revenues. There’s also a link between the average number of people involved in app development in an organisation and the revenue model. More people involved, may signal more complex development for the associated apps. The fact that this is also associated with increased revenue is possibly related to using the extra development complexity (or team size) on a more sophisticated revenue model. It is not the case that more people involved results in higher average revenues per person in general. In fact, there is a very strong peak in mean revenue per person for organisations with 6-10 people involved in development – there are probably some significant efficiency losses above this size.

The subscriptions gold mine

Across both Android and iOS, [tweetable]subscriptions generate by far the highest mean revenues[/tweetable]. Median revenues for subscriptions are also higher than every revenue model except contract development. At the same time, only just over 10% of developers use a subscription model and the average number of people involved is lower than for all but the simplest revenue models. Mean monthly subscription revenues for Android-first developers are 3 times higher than for their iOS-first counterparts. It seems that Android users not paying doesn’t apply to subscriptions. However, median monthly subscription revenues on Android are less than half those on iOS, so there are a smaller number of very big winners with Android-first subscription businesses.

Should more developers be trying to build subscription-based businesses? Almost certainly yes, but they’re not for everyone. While 53% of developers using the paid download model and 45% of those using in-app advertising are in 1-person companies, that’s only the case for 20% of subscription businesses. In fact 53% of the subscription businesses in our survey had more than 5 people, not all of which are directly involved in app development. This is because many popular subscriptions include continuously updated content and there’s significantly more work (and cost) involved in providing ongoing content for subscribers. Our survey has also shown that money is not a primary motivator for lots of developers and managing the content side of the business may not be something they’d want to be involved with. For entrepreneurs looking to build successful app businesses, the subscription model is definitely worthy of further investigation.

– Mark

Categories
Business

Engagement drives In-App Purchases for games, says Apsalar

Today’s most successful developers are giving their apps away in the app store for free, and, if done correctly, it’s an effective monetization model. At the end of October, of the top 15 grossing apps in the Apple app store, 14 of them are completely free.

This model can be both lucrative (when done correctly) and nerve-wracking, since companies are spending time and resources developing and marketing a product that they subsequently give away for free.

Fortunately for developers thinking about making a game, Apsalar’s Big Data Lab has gathered insights on some 400M unique active devices to help developers make better decisions and figure out what genres of game app developers should be making more of in order to maximize revenue.

For this report, we examined data on millions of in-app purchases. Our goal is to try and inform developers with knowledge on which game categories are most effective at driving in-app purchases and how engagement correlates to purchase events.

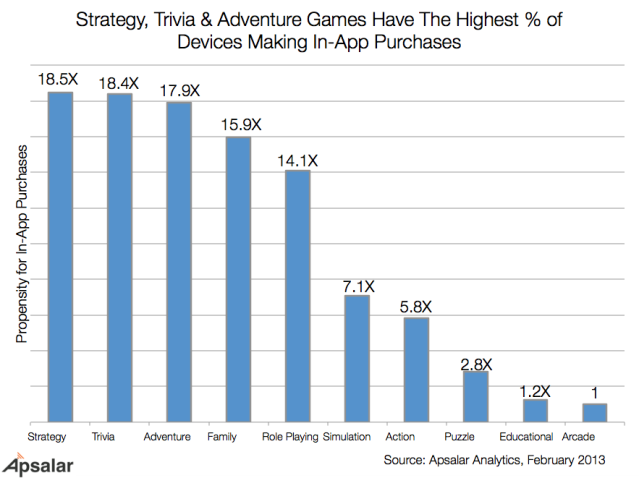
Strategy, Trivia & Adventure most effective at driving IAP

IAP_1

Our data shows Strategy, Trivia, Adventure, Family, and Role Playing games have the highest propensity for in-app purchases. Also noteworthy is the significant drop-off between the top 5 and the bottom 5 categories, as the “Simulation” category has generated about half as many in-app purchases as the “role-playing games” category. One more interesting data point on the above is how low “Action” games rank in terms of in-app purchases. The shift from predominantly casual games on mobile to more hardcore games (i.e., Infinity Blade, Rage of Bahamut, etc.) has driven some companies, who previously pioneered casual games to consider building a hardcore, action game. This data suggests that companies looking to expand beyond casual games should actually consider strategic, role-playing games as viable alternatives.

The next piece of data we looked into was average daily session length by app category. This data shows us how long users have been spending on average per day inside these games.

IAP_2

The sweet spot in terms of engagement is around 2 minutes. Interestingly, while arcade games have an extremely high average daily session length (as seen in the previous graph), they generate a relatively low number of in-app purchases.  One possibility may be that these games actually monetize best not by the freemium model, but by a business model known as paymium. In the paymium model, developers have users download free versions of their games then generate revenue by upgrading their users to, for instance, a $.99 or $2.99 paid product.

Strong correlation between IAP and engagement

The graph below presents a consistent picture between engagement and monetization, except for 2 game categories:

  • Arcade- High engagement with low monetization
  • Trivia- Relatively low engagement with very high monetization

IAP_4

The graph shows almost a straight correlation for all the data points, except for Arcade and Trivia, noted above. Trivia doesn’t appear to be an outlier though. That category generates a healthy level of in-app purchases but is still in a high engagement quadrant. The outlier is Arcade. This category has similar engagement to Trivia, Role-playing and Family (three categories that are high in in-app purchases), yet is at the bottom of in-app purchases.

A key observation is that there is no game category falling in the top left quadrant (i.e. low engagement + high in-app purchases). Which means that game developers have no chance of generating in-app purchases without high engagement.

So the key takeaway for developers using the freemium model is that it’s still critical to first focus on building a great, engaging game in one of the categories where in-app purchases are highest. Once developers have managed to do that and have engaged users, offering in-app purchases such as special items and unique gifts is a great way to take a free app and turn it into meaningful revenue.

This post first appeared on the Apsalar blog.

Categories
Platforms Tips

A/B Testing on the Amazon Appstore

In December Amazon launched a new A/B testing service for Android apps on the Amazon Appstore. Integrating A/B testing, particularly for in-app purchase related events, in the store portal is a welcome addition. Slightly disappointing considering this comes from a store provider is that the A/B testing service does not support testing different copy or icons on the storefront itself, purely in-app A/B tests, for which there are already third-party alternatives.

Not a “leaner” alternative store

When we looked at the developer platform “lean factor” for Android previously, we were only considering Google Play. Android came out on top due to the ability to publish new versions to the store almost immediately, enabling much faster iteration. However, the Amazon Appstore does have a review process which introduces significant publishing delay. As such even with the convenient addition of A/B testing baked into Amazon’s store, Google Play still offers a better environment for implementing lean development.

Testing in a smaller market

That said, there is at least one interesting use of this new service. Amazon’s Appstore has historically had a much higher proportion of users paying for downloads and in-app purchases than on Google Play – so much so that in early 2012 many developers made more money on Amazon’s store despite the much smaller audience. A smaller market with a high proportion of paying users is ideal for A/B testing improvements with the most important user group, particularly improvements to in-app purchase flows. Testing new variations on Amazon’s store and then rolling the successful ones out to a Google Play version might be a useful strategy for increasing revenues.

But how much smaller?

A final question is how much smaller is Amazon’s store in terms of downloads? They are notoriously silent when it comes to absolute numbers and even the relative numbers they give are ambiguous. In the press release for the A/B testing service linked above they say that app downloads have grown 500% over the previous year. This was in a release at the beginning of December with no fixed reference point given for the comparison. As can be seen from the relative growth chart produced by Distimo at the same time last year below, the launch of the original Kindle Fire at that time produced similarly massive growth.
Distimo_Amazon_AppStore
Dependending on where the comparison is made, a 500% increase could be anywhere from slightly behind January’s download level to 6 times the December 2011 peak. Until they provide some concrete numbers the best advice is to try it and see what your own results are like. The only major difference we’re certain of between the app buying users on the two stores is a higher proportion of tablet users at Amazon’s.

Categories
Business

How Much Is An Active User Worth?

App store analytics providers have been telling us that almost all of the growth in app revenues in the last year has been through in-app purchases. However is that just because the model has become more popular? Or because revenue has been concentrating at the top of the market where the strategy is very popular (particularly in free-to-play games)? Probably a bit of both but it’s also the case that subscriptions and in-app purchase do produce the highest overall revenues. If you exclude the developers of top apps (anyone earning over $50k per app per month on average and with over 500k active users) then it turns out that aside from apps that provide enough value to justify a subscription model, the important thing is acquiring users and keeping them engaged. The average revenue for an active user is fairly constant, regardless of the monetization method.

How much do you think is an active user worth? Take the Developer Economics Survey and have your say!

For the purposes of our survey, freemium could be a limited free app with a separate paid version promoted by the free one, or a free app with a premium upgrade via in-app purchase. In-app purchases can be any content, features or virtual goods purchased in the app, which itself can be paid or free. Paid downloads, advertising and subscriptions are hopefully self-explanatory. Note that it’s possible (and indeed quite common) for developers to use multiple revenue models, either on separate apps or within the same app – e.g. freemium with advertising in the free version. The average number of revenue models per developer in the sample above was 1.7. However, if we only look at developers using a single revenue model, the pattern is very similar (and average revenues are lower across the board).

Make the core functionality free if you can

For the majority of developers, an active user is worth around $0.04 per month. All other things being equal, unless you have a sufficient reputation or well known brand association that you can get paid downloads in large numbers, then it’s better to avoid the user having to pay directly for the core functionality of your app. This results in more downloads and a larger user base. Freemium comes out badly here, it seems that the free trial may get lots of downloads but overall slightly fewer active users (and paying users) than a straight paid download. Advertising and in-app purchases had almost identical user bases and overall revenue. Subscription apps had the smallest active user bases but by far the greatest revenue, however, this revenue model requires some kind of ongoing service that is external to the app, which will have associated costs.

In-app purchase beats advertising at the top end

The picture is a little different if you include the highest earning apps. At this point paid downloads fall far behind, both in terms of ARPU and overall user base and revenues. This is not to say you can’t have a very high grossing app with a pure paid download approach (Minecraft is a great counter-example), just that the probability of doing so is much lower. Subscriptions still come out on top but not by so much. The lower ARPU for subscriptions at this level suggests that the top subscription apps have a very popular free tier. Freemium does slightly better than paid downloads for active user base size and significantly better for revenues, suggesting that top quality paid apps with a higher price may sell better with a free trial of some kind. Finally, in-app purchases and advertising both generate the largest active user bases by offering their core functionality for free but a well designed in-app purchase scheme beats advertising for monetization by some distance.

Beware service costs eating all your revenue

In addition to revenue model selection there are also implications here for apps which connect to backend services. The average monthly revenue from an active user needs to exceed the costs of providing the service significantly to make a profit. If the majority of developers are only making $0.04 per user every month on average then say a Kinvey (purely because they price per user for iOS and Android, making the comparison easy) BaaS at $0.03 per user (for 200-5000 users at current pricing) does not leave much for the developer.


In-app purchases or ads?  Take the Developer Economics Survey and have your say! You may win awesome new gear.

Categories
Business

How Price Changes Can Improve Revenues

Distimo recently published an interesting report (free, registration required) on how app price changes affect revenue for iPhone & iPad apps. They give a breakdown on the scale of price changes but only give the really interesting results – the download and revenue impacts – averaged across all price changes. The key result is that download volumes and revenues are significantly positively impacted by price drops and negatively impacted to a lesser degree when the price rises again.

Although not specified by Distimo it’s likely that the vast majority of price rises are simply prices returning to normal after an offer ends. In this context it’s worth bearing in mind that e.g. an app with 1000 downloads/day increases on average to 9710 downloads/day after 5 days following a price drop. When the price goes back up again, the downloads fall by 57% of the increased total, e.g. back to 4175.

Demand at zero price

A factor that is not accounted for in the Distimo analysis is the discontinuity in demand at zero price. Ideally the effects of price changes that make an app free should be analysed separately from those which do not. In the former case, demand at zero price is typically multiples of demand at any non-zero price; a free promotion also relies on generating revenue from in-app purchases, advertising or subsequent increased demand after the promotion ends. On the other hand, price changes which do not make an app free are trading off price against volume. Developers can experiment with these changes to find the price point which generates maximum revenue. For most apps the marginal cost of serving additional users is close to zero and certainly dwarfed by the cost of creating the app. In this scenario, maximum revenue equals maximum profit. The zero price effect also suggests that any price drop intended to increase downloads for the purposes of increased visibility in the store should be a free promotion for maximum impact.

Longer term impact

The Distimo report shows revenue growth (purely from downloads and in-app purchases) continues for at least seven days from a price drop, reaching an average of 71% increase for the iPad and 159% for the iPhone. Beyond seven days we have a much smaller dataset from the App Rewards Club (and their analysis of Free App A Day) which suggests an initial revenue spike follows the end of a free promotion but the longer term increase in revenues is only minor, questioning the fees charged by some free promotion services.

Beware frequent sales

If a key component of your revenue model is paid downloads and temporary price drops create spikes in revenue, along with slightly increased revenue in the long run, it’s tempting to think that frequent sales will ratchet up your earnings bit by bit. The truth is likely the opposite since there are multiple services that allow consumers to check the price history of a premium app; if there are regular sales many users will simply wait for the next one. There was a good review of the issues with sales on the app store last year, however, ignore any claims that it’s impossible to succeed with premium pricing – even in the most competitive category, games, one of the most successful apps is MineCraft, priced consistently at $6.99. Most of the other top ranked premium apps either don’t have sales at all, or only do so around significant events (new major versions, holidays, new device launches).

All of this data was for iOS. According to Distimo, Google Play also shows similar effects on price changes but of a smaller magnitude due to the greater difficulty of reaching top rankings. However, the subject of price promotion on Android is much less relevant, since paid downloads make up such a tiny fraction of overall revenues.

Categories
Business

Growth Lessons from LinkedIn

Elliot Schmukler from LinkedIn spoke at a recent Growth Hacker conference about the strategies they’d used to grow the site since he joined in 2008. His advice was very helpfully summarised by Sandi MacPherson, Founder at Quibb and is general enough to be applied to mobile apps. Here’s our take on his main points.

Before you get started: Understand your channels

It’s important to understand how new users come to your product. Although it may be distributed exclusively through an app store, if that’s the only way users discover your product then you’re unlikely to succeed. This aspect of app marketing is still evolving rapidly, so keep testing different channels but focus your resources on the ones that generate the best results for you.

Categories
Business Platforms Tips

Freemium beats Premium, says App Annie

App Annie Intelligence, which tracks more than 700,000 apps, reports that freemium apps – free apps that have in-app purchases – are experiencing impressive revenue growth worldwide, far outpacing premium apps in both iOS and Google Play stores. Over the last 24 months, worldwide revenues for freemium apps on iOS have more than quadrupled. In 2012, worldwide  revenues on Google Play have grown 3.5X. Now, apps generate 69 percent of the worldwide iOS app revenue and 75 percent of global Android app revenues. Meanwhile, premium revenues for both app stores remained relatively flat in these time periods.

This confirms earlier reports of this trend by Distimo, IHS iSuppli and others.


Categories
Business Tips

50+ mobile revenue models

This hackpad (a collaborative list composed by 150 people) has an impressive list of web and mobile revenue models, ranging from the classic ad-driven models and pay-per-download to intermediaries and commerce models.
For Your Inspiration.

Categories
Business Platforms Tips

11 revenue models that bring in more cash

Developers have a range of options to choose from when it comes to generating revenue. This choice is, to some extent, dependent on business model, scale and target market. Which revenue models are most popular, and which are most profitable?


Key insights and recommendations:

  • Selling your app B2B (commissioned apps or pre-loaded on a handset) is typically much more lucrative than selling the app directly to users through app stores.
  • Models with recurring revenue from users (subscriptions, in-app purchases) come out ahead of the ‘traditional’ models like pay-per-download, freemium or ad-supported. Despite this, they’re less popular with developers, although in-app purchases are on the rise across platforms.
  • You can use multiple revenue models concurrently. It’s not an either-or decision. On average, app makers use 2 models concurrently.
  • Your choice of revenue model should be tuned to the category you’re in and the platform you’re using.
  • For iOS, an opportunity exists to produce expensive niche apps. Also, in-app purchases are more popular on iOS than on other platforms.
  • It’s more difficult to make money on Android. Your best bet is commissioned apps or a subscription model.
  • The viability of revenue models changes extremely fast. Keep a constant eye out for trends in your category.

Related tools: In-app purchasing and virtual goods | Ad networks and mediation engines