Categories
Business

The Android Monetisation Myth: iOS still rules the west

[tweetable]Revenues from Android apps saw tremendous growth in 2013[/tweetable]. If you look at the headline global figures then revenues from Android apps on Google Play are rapidly closing on those from iOS apps on the App Store. It looks extremely likely that 2014 is the year that Android will overtake iOS in total app revenues. However, dig a little deeper and you’ll find the distribution of revenues, both geographically and across apps is rather different. If you’re planning your platform strategy for this year then a dive into the details might prove invaluable.

Almost a year ago, I wrote about two important app market trends to watch in 2013, which were continued growth of app revenues (they’re still growing, Android significantly faster than iOS) and revenue distribution (it’s getting even more concentrated at the top). According to Distimo:

“On a typical day in November 2013, we estimate the global revenues for the top 200 grossing apps in the Apple App Store at over $18M. For Google Play, our estimate is about $12M. In November 2012, these estimates were at $15M for the Apple App Store and only at $3.5M for Google Play.

That’s 20% annual growth at the top of the market for iOS and just over 240% annual growth for Android. Add to that there are also alternate stores for Android that have been growing revenues too. These figures and relative growth rates make it seem as if Android is the place to be in 2014. It might be, if you can make it to the very top. If we look at AppAnnie’s report for a similar period, they estimate that total iOS App Store revenues roughly doubled year over year*, while total Google Play revenues were a bit more than triple their year ago levels. So although Apple seems to be improving the revenue distribution slightly, it’s getting even more concentrated at the top of the market on Android.

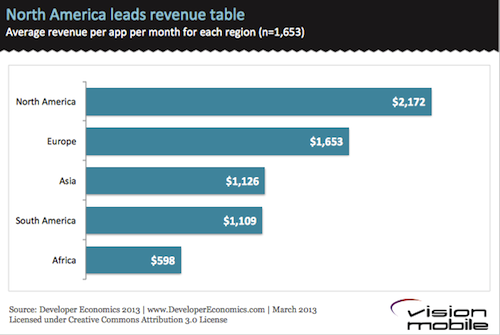
Even the wider distribution of revenues on iOS may not be quite as good as it looks when we also consider geographic spread. Although the US is still the top revenue earner for iOS, the bulk of the growth is in Asia, particularly China and Japan. The top grossing charts in these countries look very different from the global top grossing apps and this may account for much of the widening range of high revenue apps. [tweetable]On Android, the bulk of the growth and total revenue is in Asia and thus so are the top grossing apps[/tweetable]. Japan has overtaken the US as the top revenue earning country for apps overall mostly due to growth on Android. The vast majority of the increased revenue is in free-to-play games and App Annie’s report shows that in Japan, almost all of this was attributable to just five publishers. Two of those publishers were existing major games powerhouses before the mobile era and they have several well known franchises. Two more reached the kind of scale where TV advertising became a viable route to market and exploded from there. The last of the five is LINE, who built a messaging platform with over 300 million users as a channel to promote their games.

This concentration of revenues amongst five publishers in Japan is mirrored elsewhere in the world. Consider Supercell (makers of Clash of Clans and Hay Day) were at $2.4M per day in revenues in April 2013, when they were still only publishing on iOS (they’ve since launched on Android) and were in the middle of expanding through Asia. That’s more than 10% of daily global App Store revenues for the top 200 grossing apps made by one publisher with 2 apps. Supercell aren’t unique either – according to Think Gaming’s estimates, King.com’s Candy Crush Saga is making more than $900k per day, just on iOS in the US. Indeed Think Gaming give us a better idea of the distribution. Their estimates show that the number 10 grossing game makes only a 10th as much as the top grossing game and by number 100 you’re down to nearly 100th of the revenue.

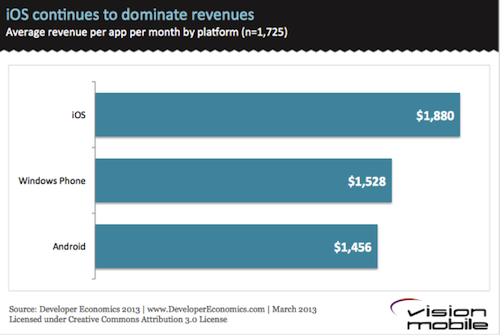
So, with revenue concentration at the top of the charts on Android even greater than on iOS, Android is the platform to target if you’ve got a world beating app with global appeal on your hands. Otherwise you’re almost certainly still better off on iOS first. Our own data, which considers revenue sources outside the app stores as well, agrees with this. If we only include the publishers earning less than $5M per month then iOS comes out on top, although if we include everyone with non-zero revenues then Android sneaks ahead. Significantly higher revenues for a tiny number of top Android developers pushes the average ahead of iOS (although the median remains way behind – there were more iOS than Android developers earning >$5M per month in our survey).

Android may become the top earning platform from App Stores in 2014 but it seems that only an elite few developers will reap the rewards. We’ve already shown that building enterprise apps and avoiding the app stores is a better bet financially but Android is not currently a lucrative platform in the enterprise market either. Still, it’s not all bad news for Android developers – the rising tide of revenues will lift all boats to some degree. Also, even 2014’s cheap Android device should be running at least Android 4.0 and have hardware capable of running almost any app well. This should reduce costs and increase the real addressable market for all Android developers. Last but not least, for an increasing number of developers [tweetable]it’s not a question of Android or iOS, it’s becoming ever more important to target both[/tweetable].

* Distimo’s year was November to November, while App Annie’s was October to October, so there may be some impacts from the relative timing of new product introductions.

Categories
Business

4 Reasons Not to Build Enterprise Apps

In an earlier post we showed how enterprise app developers make 4 times the revenue of those developing consumer apps on average. Targeting enterprises with apps can be very different from building consumer apps and not all developers prioritise revenue, so it’s not for everyone.

chapter1

Do you want the indie developer lifestyle, or to build a company? What sort of contact do you want to have with your customers? Do you like consulting work or do you prefer to build your own products full time? Do you have a strong development platform preference? Depending on your answers to these questions you might find one of the 4 reasons below keeps you focused on consumer apps for the foreseeable future.

1. You like to work alone

The creation of the app stores enabled vast numbers of individual developers to create and monetise their own apps. Amongst the revenue earning developers targeting consumers, almost 43 percent are in one person companies and practically all of those don’t involve anyone else in development. Of the developers building apps for enterprises, only 13.3 percent are in one person companies and those are almost exclusively doing contract work. The one person enterprise development companies earn 24% more revenue than the equivalents building consumer apps but it’s definitely not the independent developer lifestyle they’re living. In general the enterprise developers earn more than those developing for consumers at every team and company size, with the difference increasing with team size up to the 500 employee mark. Above that revenues from app development per person drop significantly, although on both sides a lot of large companies developing primarily for reasons other than earning revenue are included here.

2. Direct sales repels you

As you can see from the charts above, enterprise app developers tend to work in larger companies than those targeting consumers. There’s also a bigger company size to team size ratio. The difference here is likely to be sales, marketing and support teams. In general, larger customers need more direct contact. In the consumer apps space it’s possible, although unlikely to be successful, to launch an app and sell it without ever having contact with anyone that uses it. However, although the costs of direct sales staff may seem high, consumer apps with large revenues and user bases typically pay to acquire a decent fraction of users (e.g. via in-app ads, Facebook app install ads, cross-promotion networks). We don’t have any data to compare the cost of sales for these developers but I wouldn’t bet that the average cost of sales as a fraction of revenue for the successful consumer app developers was significantly lower.

Whilst subscription revenue is by far the best earner for consumer app developers, it is one of the worst revenue models for enterprise developers. In the enterprise market per user/device licensing and other sales outside of app stores is a key revenue component for most successful businesses. This aspect of a business can often be very unattractive to developers.

3. You want complete creative control

On average [tweetable]enterprise app developers earn a much greater fraction of their revenue from contract work[/tweetable] (consulting). The most successful enterprise app businesses earn 25-75% of their revenue in this way (we only have 25% bands). It’s likely that there’s a lot of custom integration work involved in selling to larger enterprises. Even those selling to SMEs often offer customizations.

Developers who consider their apps an art-form and build them primarily to earn a living doing something creative they love will probably want to stay away from areas where a lot of contract work is involved. Those same developers are also not very likely to be inspired to help automate business processes or other similarly mundane but useful enterprise app functions.

4. You love Android development

There are some very major differences in the revenue models and revenues of enterprise app developers depending on their primary platform. The really big revenues are currently being earned by HTML5 developers (> $100k per developer per month). Next highest revenues are for iOS developers (a little over $50k per developer per month) but it seems that [tweetable]a lot of iOS app enterprise development is currently outsourced[/tweetable], since more than 70% of these earn >75% of their revenue from contract work and 40% earn 100% of their revenue in that way.

Compared to these two, the Android developers are the poor cousins. Despite having a much wider range of revenue models, their average revenue per developer is much lower (about $14k per month). Enterprise development still pays very slightly better on Android than building consumer apps but given the other trade-offs discussed above, it might seem like a relatively poor deal.

Running out of excuses?

When we published the last article, showing that enterprise developers make 4 times as much revenue as those targeting consumers, a lot of responses suggested that this difference was all in the large enterprise sales market and required large direct sales teams. While there is definitely some advantage to scale, this is certainly not the case. Not all enterprises are large and there’s a very big market of SMEs looking for mobile software to make their businesses more efficient or convenient. Although the most profitable enterprise app development companies are in the 51-500 employee range and solo developers are only marginally better off targeting enterprises, a 2-5 person company makes more than 4 times as much revenue on average by choosing to build enterprise apps. The 2-5 person enterprise app business is much more likely to be building HTML5 hybrid wrapper apps rather than the native iOS or Android apps of a similar sized consumer focussed business. They are also likely to be spending more of their time (although far from all of it) doing contract work. If neither of those things bothers you then it might still be worth considering the enterprise market for your next app.

Categories
Business

Why are you still building consumer apps? Enterprise pays 4x more!

Consumer apps are the focus for all the excitement and media attention in the industry. Enterprise software is dull and boring, right? Not if you care about making money! Our data shows [tweetable]enterprise developers generate 4 times as much revenue as those targeting consumers[/tweetable]. Besides, what’s so dreary about reinventing the way people work in a mobile and connected world?

Print

“Wait”, I hear you cry, “what about BYOD and the consumerization of IT? Surely the future is all about selling computing tools directly to professionals?” Well the data from our April-May 2013 Developer Economics survey says that future isn’t here yet. In any case, if you’re going to collaborate with colleagues then you all need to be using the same tools, so most of the time the company still has to choose and buy them.

We asked developers which type of customer they primarily targeted from a selection of Consumers, Professionals, Enterprises, Other and Not Sure. Using this data we can compare the fortunes of developers serving each of those audiences.

It’s entirely natural that a new consumer-focussed computing market for smartphones and tablets spawned a large industry of consumer focussed app development organisations. The market is rapidly maturing now, with smartphone penetration above 50% in all developed markets and tablet adoption not far behind, yet still almost 75% of companies involved in app development are focussed on consumer apps. Traditionally software spending has been much higher in enterprises and although there is a shift towards employees selecting their own technology and tools it is surely not happening as fast as the shift to mobile computing. This leaves a gap in the market for developers focussed on apps for the mobile enterprise to fill.

A little over 12% of the money-making developers in our survey were targeting the enterprise yet they made on average almost 4 times as much revenue (per person involved in development) as those targeting consumers and typically had more than 4 times as many people involved in app development. Developers targeting professional users rather than their companies only made about 50% more revenue per person than consumer focussed developers and had about twice as many people involved in development. So, while this is a promising market, [tweetable]independent app developers are not replacing the enterprise IT department just yet[/tweetable].

At the bottom of the revenue pile it’s no big shock to see that developers who aren’t sure about their target market make by far the least money. How do you build a great product without knowing who it’s for? The small number of respondents who felt their audience didn’t fit one of our categories, selecting “Other”, may possibly be targeting too small a niche since their revenues are not far above half those of developers building consumer apps.

It’s important not to get confused by the similarity of the increased development team size and higher revenue figures – the chart shows revenue per person, so the effect multiplies. That is, the average enterprise focussed app development organisation is making around 16 times as much revenue as the average consumer focussed one in total. That makes the total revenues of the enterprise developers significantly greater than those of the consumer developers, even though there are around 6 times as many of the latter. Averages hide a lot of detail though. You don’t have to build a large company to be extremely profitable in the enterprise mobility market – smaller development teams actually have much higher revenues per developer. More details on that and important differences between consumer and enterprise app developers will be the subject of a future post.

Agree with our figures or disagree? Drop us a comment.

– Mark (@__MarkW__ )

Categories
Business

App monetisation: Games vs. Enterprise and Business Apps

The mobile apps business is maturing and while most of the media attention is still focussed on the latest app store success stories, developers are finding lots of better ways to improve app monetisation. Considering all revenue sources, which categories of application are generating the most money and what’s the competition like on each platform?

DE12c3_web

App Stores not the answer?

In our last developer economics survey we asked developers to give us a breakdown of their revenue from different sources. Of the 1,695 developers earning between $1/month and $5 million/month who reported their revenue breakdown to us, 55% generated some of their income from app stores. There is a negative correlation between the fraction of revenue an organisation earns from app stores and the total revenue they earn per person involved in app development. That is, the more you rely on app stores for revenue, the less you are likely to make any. By excluding those with revenues above $5 million/month, we’re ignoring the very top of the store charts where the bulk of app store revenue is made. However, this is just a handful of developers, who would otherwise have an extremely disproportionate effect on the average. It’s also worth noting that [tweetable]there are limited costs involved in app store publishing but it produces the lowest average revenues of all sources[/tweetable] in our survey – it’s clearly not the easiest way to build a profitable app business.

Is there gold anywhere but games?

With games accounting for around 75-80% of all app store revenues it’s possibly not surprising that they were the most popular category of app amongst the developers in our survey. Given the chart above it shouldn’t be surprising that they are far from the most profitable (~$2,500/person/month more than the lowest mean income and the lowest overall median income). So [tweetable]which were the most profitable app categories? Business Productivity and Enterprise apps[/tweetable]. However, there are some significant differences between platforms so it’s worth playing with the interactive chart below to spot any opportunities that might be of interest.

[tweetable]Median developer revenues are higher on iOS than Android across all categories[/tweetable], but in some categories mean revenues are higher on Android. This shows that there are some developers managing to exploit the much larger market on Android successfully but most developers are still financially better off on iOS, including revenues from outside the app stores. Where average revenues across all platforms were higher than either iOS or Android, web developers were usually making the most revenue in that category.

The averages in the charts above still hide a lot of potentially interesting detail on where the best opportunities in the apps market are. Those wanting a more complete analysis should look at our App Economy Forecasts report.

Categories
News and Resources

India – your next apportunity?

The world is getting ‘App’ified – and India is entering the fray at full force! Apps are an important element of consumer mobile behaviour – share of time spent on voice calls and texting is reducing, while time spent on apps and internet browsing is rising. With India rapidly growing as a major app superpower, it is important to understand the underlying drivers of this rapidly growing ecosystem.

Is there an “apportunity” for your app in India?

The Rise of India as an App Superpower

If you are creating an app in a localised language, you should also read The App Localisation Opportunity.

Categories
APIs Tools

Which apps make more money? App monetization insight from our Developer Economics 2013 report

[This post by Andreas Pappas, Senior Analyst at VisionMobile, first appeared on the VisionMobile blog on April 3, 2013.]

[How do app developer revenues vary by country, or platform? Does the number of platforms make a difference to app revenues? Which models bring in the most revenues? We revisit Andreas Pappas’ November analysis of app monetisation with more insights from our Developer Economics 2013 survey across 3,400+ developers – while launching our latest survey, which is available here]

Developer-Economics-volume-5

Back in November, we looked at which apps make money based on research on how app revenues vary by platform, app category, country and more. In this article we update our analysis on app monetisation based on the latest research from Developer Economics 2013 across 3,400+ app developers, including analysis that did not make it into the report.

We ‘re also proud to launch our very latest Developer Economics survey, which reaches across thousands of app developers and provides the data for our famous state of the developer nation reports. Thanks to the sponsorship by BlackBerry, Mozilla, Intel and Telefonica it possible to provide these reports and additional insights, for free, to the entire mobile community.

Take part in the survey, spread the word and help us drill deeper into the app economy and what makes it tick. We have prizes aplenty for developers, with 7 devices up for grabs (one iPhone 5, two Samsung Galaxy SIII, two Nokia Lumia 920 devices and two BlackBerry Dev Alpha handsets) – plus an AR Drone 2.0, a Nest Learning Thermostat and a Nike Fuel Band for participants who also subscribe to our developer panel. Last, but definitely not least, our friends at Bugsense are giving away one month of free crash reporting to each and every participant.

Survey Q1 2013


Developers in North America lead the revenue leaderboard

We’ll start by taking a look at income distribution by the region where app developers are based. Last time we saw that US developers earned almost double the revenue of UK developers. Based on our Developer Economics 2013 data, North America (and particularly the US) is still in the driving seat of the mobile app economy with developers in North America generating about 30% more than their european counterparts, who in turn generate 47% more revenue than developers in Asia. To some extent higher revenues for NA developers are explained by higher consumer spending in the US and higher penetration of iOS, which as we will see later on, still generates higher revenues than other mobile platforms. Note that across this analysis we are restricting our sample to mobile app developers, and have excluded the top 5% of revenue earners in order to minimise the effect of outliers.

North America leads app revenue leaderboard

While app development activity is booming in Asia, the average app-month revenue is quite lower than in the US and Europe, although developers in Asia develop, on average more apps and use more mobile platforms. As we explained in the previous article, there are multiple reasons for this revenue gap, but the prevailing reason is the fact that paid apps are not popular in most of Asia, the country that drives the Asian app economy. Instead, developers in Asia rely much more on advertising revenue, which, according to our findings is the least profitable revenue model.

iOS still monetising better than other platforms

iOS continues to dominate platform revenues, generating, on average, 30% more revenue per app-month than Android. The revenue gap has reduced by 5 percentage points compared to that reported in our Developer Economics 2012 report in June 2012.

iOS continues to dominate revenues

At the same time, Windows Phone has caught up with Android and seems to be doing slightly better. Although the 5% advantage is arguably within the margin of error, Windows Phone has significantly improved its position relative to the figures reported in the Developer Economics 2012 survey, when it generated, on average, about half as much revenue as Android. How has the landscape of platform monetisation changed in Q2 2013? Join the survey and help us track the state of the developer nation.

Multi-platform developers earn more

Developers using more platforms earn more

There is a wide revenue gap between developers/publishers using 6+ platforms and those using 5 or fewer platforms, with those developing for 6+ platforms generating, on average, 75% more revenue. However, only a small part of the developer population (4%) develops on 6+ mobile platforms; these are probably established services with a large footprint that want to ensure that their apps are universally available (e.g. Facebook, Skype etc.) or large software houses with a large enough pool of resources to target multiple platforms for their customers.

Those developers employing just one platform are probably solo, amateur developers or have not yet had the success that warrants (and allows) an expansion onto more platforms. As developers become more successful, they will expand onto new platforms and generate more revenue. So while, expanding on more platforms is not sufficient to generate more revenue on its own, those that do find success are likely to invest in a multi-platform strategy.

Extending apps to new markets is a profitable strategy

We asked app developers how they decided on which apps to develop or work on next and then looked at the way revenues vary depending on their strategy. While most developers will develop apps they want to use themselves (50%), this is apparently the least successful strategy and should not become the sole deciding factor for your next app.

Extending apps into new markets pays better

Developers that use some form of market research such as discussing with users, monitoring apps stores or directly buying market research are much better off, generating at least double the revenue of those who just develop the apps they want to use. However, market research is not widely used among the developer population: only 24% of developers discusses with users, highlighting a lack of business maturity and also a gap in frictionless 2-way communication channel between developers and users.

Overall, the most successful developers are those that extend apps to new markets, either to new geographies or different verticals. To some extent, these strategies rely on copying the recipe of an already established and successful business: these are apps that have been tried and proven in at least one market and are generally less risky options or “low hanging fruit” for developers. Why start from the ground up when you can stand on the shoulders of giants?

The most lucrative revenue models are off limits for most developers

When talking app monetisation, there are over 10 different revenue models to chose from. Device royalties and distribution licensing fees are the top-grossing models but are quite rare among app developers due to their high barriers to entry. These models imply deals with device manufacturers and distributors which means long, expensive sales cycles and a successful app to start with. Among the rest of the revenue models, commissioned apps (development for hire) come on top since they come with a low risk and guaranteed income for developers that work under contract.

Royalties & licencing fees pay better

The next most lucrative revenue model is the subscription-based model but this also comes with caveats: a subscription service implies a significant investment in licensing, and maintaining quality content or services that keeps users engaged on an ongoing basis.

Among the revenue models that are most popular and more accessible to developers, In-app purchases come on top, generating, on average 34% more revenue than Freemium and 43% more revenue than Pay-per-download. In-app purchases and Freemium models are becoming increasingly popular, now being used by a quarter of developers as they seem to be appealing to consumers. We ‘re revisiting the topic of most lucrative revenue models in our latest survey. Join in and help us size the app economy.

Smart developers use smart tools

Finally, we take a look at how developer revenues correlate to the use of third party tools and services. It’s interesting to see how app revenues correlate with usage of performance tracking and management tools like user analytics and crash reporting. Developers using crash reporting and bug-tracking tools such as Crittercism or BugSense generate on average, three times more revenue than developers who don’t use these. Similarly the usage of User Analytics (e.g. Flurry, Apsalar) services is also associated with much higher revenues, with those using user analytics services generating 168% more revenue than those who don’t.

Higher revenues for developers using dev tools

Both user analytics and crash reporting services are used by experienced developers who recognise the importance of optimising for user acquisition, activation and retention, while reducing in-the-field crashes and the resulting user churn.

Track the state of the developer nation

[tweet_this content=’App developer? Take the new Developer Economics survey and win prizes!’ url=’ http://www.visionmobile.com/DS13PortalBlog’]These insights are made possible by our ongoing surveys. Join the latest Developer Economics survey to help us draw deeper insights into monetisation, the size of the app economy and the debate of HTML5 vs. native. In this survey we ‘re focusing on the population of iOS, Android, WP, BlackBerry and HTML5 developers, across countries, app categories and developer types. If your are a developer take the survey, or otherwise spread the word and watch this space for an update on revenues, platforms and the state of the developer nation.[/tweet_this]

And don’t forget to fire away with those comments, rants, criticism, praise or simply feedback on what you ‘d like to see next.

Andreas (follow me on twitter @PappasAndreas)

Categories
Tools

Capturing More Value with Voice Services

Of the tools and services for developers we asked about in our last survey, one category stands out by miles as having the wealthiest developers: voice services. If we exclude developers earning over $50k per app per month (as we typically do for other tools categories since a small number of successful developers can heavily distort the data) from those interested in money and reporting their income to us, then those using voice services earn an average of $4379 per app per month. This is a similar level of revenue to those using crash analytics services, which we’ve already shown is correlated with financial success. However, excluding those earning over $50k per app per month is rather unfair for voice services since this is almost 10% of developers using this tool category; if we include them, the average rises to $13410 (the comparable figure for those using crash analytics is $8764). Of course there’s a lot of variety in the voice services sector and the revenue is not at all evenly distributed.

Popular is not always profitable

In order of popularity, the most used services in our survey were Twilio, Skype, Mircrosoft & Tropo. Of those, the best in terms of revenues, Tropo, had 77% of developers above the “app poverty line” of $500 per app per month, whilst the worst, Microsoft, had 77% earning below that level of revenue. Outside of the top four services by popularity, there was a wide range of developer success but the average revenue was very close to the average for the whole category.

Skype is an extremely popular consumer service but their services for developers, particularly mobile developers, are quite limited in scope. SkypeKit, which is their offering for embedding Skype functionality in devices and other apps is not permitted to be used in mobile devices. Although Microsoft has similar capabilities to Twilio and Tropo through their acquisition of TellMe that is not yet fully integrated into their standard developer offering. If they try to use their capability to differentiate the developer offering for Windows Phone then it’s likely to remain limited by the success of their mobile platform.

Isn’t voice commoditised?

Whilst having voice services tied to a single platform is not ideal, cross-platform availability is not critical. Developers whose main reasons for selecting their service included cross-platform availability earned a below average for the sector but still very respectable $8120 per month. Those focused on call quality did slightly worse, while developers whose primary concern was cost did very poorly at only $2280 per month on average. At the top end of the spectrum, the only reasons correlated with revenues above $20k per month were feature set and scalability. The feature set breakdown in our survey makes it much clearer where the bulk of the money is being made by users of voice services. Fortunes are not being made by delivering generic VoIP services to giant user bases; in fact, the average number of active users for the most popular apps of developers across the whole voice services sector is only about 27,000. On the contrary developers using voice services for inbound calls averaged $25k per app per month, while those using intelligent call routing and/or Interactive Voice Response (IVR) systems averaged $30k per app per month. While it is possible that there are some developers doing good business using these cloud services to replace legacy IVR services or extend the reach of such services to smaller businesses, it’s very likely that many of these developers are building customer services channels for their own apps. In this case there’s some survivorship bias here – only fairly large and successful businesses would build out such complex customer services systems. Also it’s quite likely that businesses that need voice and SMS based customer service channels are about more than just an app, in which case the revenues associated with the apps may reflect sales of external goods, services or content and are thus not directly comparable with those of developers purely monetizing through paid downloads, advertising or in-app purchases (although all of these revenue models are used by some developers using these voice features).

Consider the costs

When you consider that numbers rented, call minutes and SMS’s sent all have associated costs from the voice services provider it’s not so surprising that a typical voice services developer has higher revenues – they need to in order to stay in business! The existence of these voice platforms is strong evidence that basic voice is commoditised and there’s very little room for differentiation or profit simply packaging and branding such services for consumers. So, while the revenues for all kinds of voice app are higher than average, the associated costs are higher too. Those developers that capture significant value with voice services are using them to add value to some other service, rather than trying to re-sell them directly. That said, these services are very easy to use and relatively inexpensive. It’s worth thinking about ways you could use them to build better relationships with the customers for your app business.

Categories
Platforms

Kids’ Educational Apps – An Indie Dev’s Final Frontier

VM_010

I am wondering if you know that there is an SXSWedu event. Well I can’t blame you if you don’t, it is the third year it is running and it sounds a bit off when you think of SXSW and “Keep Austin weird”. If you don’t then it will even come more as a surprise to learn that Bill Gates delivered the closing keynote to a standing-only room of 2,500 people.  On top of that, Apple revealed to TechCrunch a couple of weeks ago that they have sold more than 8 million iPads to educational institutions worldwide (4.5 million to U.S. schools).

You might have started thinking that putting together an educational app may not be such a bad idea, I mean how hard can it be? How about checking out the App Store’s top 200 paid list of iPad educational apps? Just by going through it, even if you don’t know who is who, you will see a lot of indie developers. Let me save you the trouble and give you the rundown. Of the top 200, 70% are kids’ educational apps. Out of these, roughly 80% are by independent developers, and only 20% from well-known publishers like Disney, Nickelodeon, Sesame Street, etc. This is really impressive to say the least.

But before you team up with a teacher and start coding that idea, hold on. For every developer who is succeeding, there are 20 who are struggling to see noticeable sales. To make matters worse, only 20% of the developers present in 2009 were still active in 2012 (iLearn II – “An Analysis of the Education Category of Apple’s App Store”).

All of this translates to the indication that there are still great opportunities in kids’ educational apps right now, but there is also a lot of risk. That is why the kids’ educational apps market is an indie dev’s “final frontier”. So before you set off to “boldly go where no man has gone before”, here is a survivor kit to keep in mind when navigating those treacherous waters:

1)    App stores lack specific categorizations

No single app store has a separate category of kids’ educational apps. So kids’ educational apps are all scattered in a number of categories. In the Apple App Store they are scattered across Education, Games/Educational, Games/Kids, Books, etc., and in the Windows Phone Marketplace between Education and Kids + Family. Keep that in mind as you pick your category and since there is no right or wrong,  don’t be afraid to experiment.

2)    Never ever forget market segmentation

It is an easy assumption to make but it is one that you must always keep in mind. Education differs across countries considerably, it is not only the language and cultural barriers, but also that educational topics are approached in different angles. In the US the past three years the Common Core Standards initiative has been put together that provides a clear understanding of what students are expected to learn so teachers and parents now what to do to help them. CCS can be a very useful roadmap when you are thinking of your app. Lastly always factor in that localization will not be easy and it will cost more than it would normally do.

3)    You have limitations on your monetization strategy

With stories of a 5 year old spending $2.500 on iPad apps in 10 minutes hitting the news frequently be very careful of your monetization strategy. I am not arguing to exclude In App Purchases but be very cautious about your implementation and disclose this information to parents.

4)    Be wary of COPPA

Talking about disclosures you need to get up to speed with the Children’s Online Privacy Protection Act. You need to have a privacy policy, provide disclosure about data practices and take responsibility for data practices of 3rd party code. Lorraine of Moms With Apps has put together a great reading list on the subject here, which is always updated.

If then you are up to being one of the risk-takers that Bill Gates mentioned in his speech, help change the face of education and make money on the way keep in mind his closing words “In this space, we either improve the quality of education or we stay flat, like we have for the last few decades”, put your soul into it and make great educational apps.

Categories
Platforms Tips

A/B Testing on the Amazon Appstore

In December Amazon launched a new A/B testing service for Android apps on the Amazon Appstore. Integrating A/B testing, particularly for in-app purchase related events, in the store portal is a welcome addition. Slightly disappointing considering this comes from a store provider is that the A/B testing service does not support testing different copy or icons on the storefront itself, purely in-app A/B tests, for which there are already third-party alternatives.

Not a “leaner” alternative store

When we looked at the developer platform “lean factor” for Android previously, we were only considering Google Play. Android came out on top due to the ability to publish new versions to the store almost immediately, enabling much faster iteration. However, the Amazon Appstore does have a review process which introduces significant publishing delay. As such even with the convenient addition of A/B testing baked into Amazon’s store, Google Play still offers a better environment for implementing lean development.

Testing in a smaller market

That said, there is at least one interesting use of this new service. Amazon’s Appstore has historically had a much higher proportion of users paying for downloads and in-app purchases than on Google Play – so much so that in early 2012 many developers made more money on Amazon’s store despite the much smaller audience. A smaller market with a high proportion of paying users is ideal for A/B testing improvements with the most important user group, particularly improvements to in-app purchase flows. Testing new variations on Amazon’s store and then rolling the successful ones out to a Google Play version might be a useful strategy for increasing revenues.

But how much smaller?

A final question is how much smaller is Amazon’s store in terms of downloads? They are notoriously silent when it comes to absolute numbers and even the relative numbers they give are ambiguous. In the press release for the A/B testing service linked above they say that app downloads have grown 500% over the previous year. This was in a release at the beginning of December with no fixed reference point given for the comparison. As can be seen from the relative growth chart produced by Distimo at the same time last year below, the launch of the original Kindle Fire at that time produced similarly massive growth.
Distimo_Amazon_AppStore
Dependending on where the comparison is made, a 500% increase could be anywhere from slightly behind January’s download level to 6 times the December 2011 peak. Until they provide some concrete numbers the best advice is to try it and see what your own results are like. The only major difference we’re certain of between the app buying users on the two stores is a higher proportion of tablet users at Amazon’s.

Categories
News and Resources

Tablets go mainstream, TV apps still niche

In our latest developer survey we asked developers about the different screens they target. The results show smartphones are the most popular target, whilst tablets are catching up fast. PCs are most commonly targeted by web developers while TVs are still a niche app market for all developers.

TV development

The majority (86%) of 3,460 developers in our survey develop on smartphones, while a large share of them also develop on tablets, led by iOS developers (76%) indicating the attractiveness of the iPad as a development and monetisation platform. Despite the rise in Android tablet share during 2012, we did not observe a significant increase in the share of Android developers targeting tablets (64% vs. 62% in our Q1 2012 survey) although we believe this is likely to change in the near future.

HTML developers take a more platform-agnostic approach, as they develop across smartphones, tablets and PCs almost equally, according to our survey, a testament to the use of HTML as cross-screen app development technology. At the same time, HTML limitations, such as lack of support for native APIs, tooling and device optimizations, prevent it from becoming a swiss-army knife for cross-platform development.

TV development remains niche, at the same levels reported in Developer Economics 2012, as the hype cycle around the “Smart TV” experience is yet at a very early stage. This seems in line with findings from research firm NPD, who reports that only 15% of HD TVs are connected to the internet (directly or via a set-top box), limiting their appeal to app developers. Additionally, only a small fraction of those connected TVs use apps for anything other than streaming video or music services. There is a much faster growing trend for the TV screen to be used via smartphone or tablet apps “throwing” content to it.
[doritos_report location=’DE13 Article – Targeting Screens’]