Categories
Business

Revenue Haves and Have Nots

While not all developers are in it for the money, most would like their apps to provide an income and the majority of those struggle to earn revenues that will sustain further development. We defined $500 per app per month as a reasonable global “poverty line”, in some countries this is very low while in others it’s a very good income. It’s also worth noting that many developers have multiple apps in the market so it doesn’t represent total income. As we’ve highlighted previously, the revenue distribution on the app stores is highly skewed toward the top and this is a major issue for the health of developer ecosystems going forward. Some developers may feel that the level of competition on Android and iOS is too high and they are thus tempted to try one of the smaller marketplaces in search of revenues. Our survey says that this is likely to be a mistake, there is indeed a wide variation in revenue distribution by platform, but the smaller markets have an even higher proportion of developers below the poverty line. The reduced competition is more than offset by the smaller user base at present.

Developer Economics 2013 - Revenue distribution by platform

Around 18% of 3,460 respondents in the Developer Economics 2013 survey indicated that they are not interested in making money from apps. Nevertheless, out of the vast majority of developers that are in it for the money, 67% are not making enough to sustain them or their business, i.e. they are below the “app poverty line” of $500 per app per month. For the majority of developers, app development is not financially rewarding.

Overall, less than 1 in 5 Blackberry developers make more than $500 per app-month. The situation is almost as challenging on Windows Phone where just 19% of developers generate more than $500 per app-month, with 61% below the poverty line. The findings of our survey are somewhat better for Android and iOS although these platforms too, are far from a developer paradise: 55% of iOS and 54% of Android developers are below the poverty line. Excluding developers that are not interested in profit, 62% of iOS developers and 67% of Android developers are not making more than $500 per month per app.

HTML seems a surprise here with just 45% of HTML developers under the poverty line, far lower than any other platform. However, there are fundamental differences between HTML and native platforms which are responsible for the differences observed here: developers using HTML for web development have access to a much larger user base comprising desktop and mobile users, irrespective of platform. Among HTML developers, subscription-based revenue models are much more popular than on native platforms pointing to established online content or service businesses that have expanded on to mobile.

[doritos_report location=’DE13 Article – Revenue Distribution’]

Categories
Business

How Many Users Is Realistic?

One of the most common mistakes developers make when planning the business case for a new app is dramatically overestimating the number of users they will be able to attract, particularly for their first app. The typical argument goes something like this: “My app will be compatible with 400 million devices, if I can reach just 1% of those, that’s 4 million users”. The trap here is that 1% sounds like a very conservative fraction of the installed base to target but in reality it is incredibly high. Of the 664 respondents in our latest survey who integrate user analytics and provided us with their information about the active user base for their most popular app, only 6% had over 500,000 users. The nature of store charts and limited promotional space means that those who break the half million user barrier are quite likely to gain many, many more users than that, however, what’s a realistic figure for everyone else?

One of the more interesting findings we published was that, excluding those with more than 500,000 users, the mean average active user base for iOS developers was 70,000 users vs. 51,000 users on average for Android. The median user base, is 27,500 users for iOS and 15,500 for Android. The percentage difference between means is much smaller than that between medians, suggesting that the distribution of active user bases in general is worth further investigation.

As can be seen from the chart above, 200,000 – 500,000 users is the least common user base size, despite being twice as large an interval as the 50,000 – 200,000 option immediately below it. This suggests that there is a threshold level somewhere near 200,000 users, such that if you break that level you’re likely to “get noticed” and end up with significantly more users. There’s a similar bump near the bottom end of the scale where 501 – 2,000 users is more commonly reported than 2,001 – 5,000 users. This is likely to reflect the difference between apps which are not (effectively) marketed and those that are.

In addition to the platform differences noted above, there are also interesting differences in user base size by revenue model and app category. For example, apps using advertising as a revenue model (and therefore presumably free downloads) are more likely to gain over 50,000 users than other models, whilst freemium shows a very similar distribution to paid downloads. The games category is incredibly competitive and developers there are less likely to have more than 50,000 users, whilst developers in the music and video category had the highest probability of breaking both the 50,000 and 500,000 user barriers. The combinations of revenue models and categories are almost endless but the chart above has dynamic filters so you can explore the opportunities in your own app category. Please let us know about anything interesting you find in the comments below.

Categories
News and Resources

Tablets go mainstream, TV apps still niche

In our latest developer survey we asked developers about the different screens they target. The results show smartphones are the most popular target, whilst tablets are catching up fast. PCs are most commonly targeted by web developers while TVs are still a niche app market for all developers.

TV development

The majority (86%) of 3,460 developers in our survey develop on smartphones, while a large share of them also develop on tablets, led by iOS developers (76%) indicating the attractiveness of the iPad as a development and monetisation platform. Despite the rise in Android tablet share during 2012, we did not observe a significant increase in the share of Android developers targeting tablets (64% vs. 62% in our Q1 2012 survey) although we believe this is likely to change in the near future.

HTML developers take a more platform-agnostic approach, as they develop across smartphones, tablets and PCs almost equally, according to our survey, a testament to the use of HTML as cross-screen app development technology. At the same time, HTML limitations, such as lack of support for native APIs, tooling and device optimizations, prevent it from becoming a swiss-army knife for cross-platform development.

TV development remains niche, at the same levels reported in Developer Economics 2012, as the hype cycle around the “Smart TV” experience is yet at a very early stage. This seems in line with findings from research firm NPD, who reports that only 15% of HD TVs are connected to the internet (directly or via a set-top box), limiting their appeal to app developers. Additionally, only a small fraction of those connected TVs use apps for anything other than streaming video or music services. There is a much faster growing trend for the TV screen to be used via smartphone or tablet apps “throwing” content to it.
[doritos_report location=’DE13 Article – Targeting Screens’]

Categories
Tools

Cross-Platform Tools – Does it pay to use them?

In our January 2013 Developer Economics Report, we revealed that multi-platform developers are better off. Our survey data also reveals, rather unsurprisingly, that users of cross-platform tools (CPTs) target more platforms than those building separate apps for each platform. Of those interested in making money, users of CPTs target 4.33 platforms (3.1 mobile platforms) on average vs 3.46 platforms (2.57 mobile) for those building separate apps. We also know that the most popular class of CPTs (using web authoring languages) tradeoff app capability to get the increased portability. At the same time, popular opinion on the internet and amongst venture capitalists is that a cross-platform user experience can’t compete with using the platform native frameworks. So how do these tradeoffs translate into revenue for CPT users?

CPT users make more revenue

On average, CPT users make slightly more revenue per app per month than developers not using such tools. With the reduced cost of development provided by the CPT, this suggests that they’re significantly more profitable.

Averages can be deceiving where the distribution of results is far from normal, as with app revenues, so it’s worth examining the details. App revenue is heavily concentrated at the top end of the market, with a large fraction of the (mean) average coming from a small number of very high earners. If we exclude all developers earning more than $50k per app per month then the result holds – CPT users still generate more revenue.

Not all CPTs are created equal

There are also several different types of CPT. Games have been responsible for close to half of all app revenues (at least those generated directly through app stores) and since they typically don’t require many platform-specific APIs or UI elements, they’re a good candidate for building with cross-platform. This suggests that users of primarily games-centric CPTs like Corona, Unity 3D & Marmalade might be responsible for the out-performance of CPTs, while users of the low development cost tools taking advantage of web authoring languages, such as PhoneGap, Appcelerator, Brightcove & Sencha, generate slightly lower revenues. However the data shows that the opposite is in fact the case.  Users of the games-centric CPTs are generating below average revenue, whilst the web-centric CPT users are significantly better off. These results also hold whether or not we include those earning over $50k per app per month.

A plausible explanation for this is that most of the larger and more successful game developers are managing their own cross-platform compatibility or code re-use whilst many smaller independent game developers relying on 3rd party tooling are struggling with the fierce competition in the games market. At the same time it seems that, when it comes to revenue, a fully native user experience and native performance are not as important as their proponents suggest. The very high earners using web-centric tools are most likely to be existing publishers selling their content through mobile app subscriptions and our revenue estimates are probably too low, since the top income band in our survey is everything over $100k per app per month.

Both ends of the revenue spectrum

For several CPTs in our survey we didn’t have enough respondents to be sure differences in revenues for individual tools are statistically significant, however, there are a couple of individual ones worth highlighting. At the low end, revenues for Qt developers were significantly below average – this probably reflects the fact that Qt does not yet have official support for iOS or Android (planned for this year). At the high end, although we only had a relatively small sample, revenues for Brightcove App Cloud users were more than 3 times the average making the difference statistically significant, whether or not we include those generating over $50k per app per month. Brightcove appear to be focussing their solution on a particularly profitable market segment.

Tool selection – do it for the right reasons

Finally, if you’re looking to select a CPT, make sure you do it for the right reasons. Main selection criteria including access to native APIs and the ability to create a native UI look and feel are correlated with above average revenue, whilst the availability of third party extensions and choice of authoring languages are correlated with below average revenue. The former criteria look to minimise some weaknesses of the cross-platform approach whereas the latter criteria focus on reducing one-off costs. The latter are not necessarily bad reasons for choosing a tool but if they are amongst the most important reasons for your selection then it’s worth re-evaluating priorities. Work out what will enable the creation of the best product at acceptable cost rather than simply minimising cost. If the lowest possible development cost is critical to make the app concept viable then it’s probably time to come up with a higher value concept.

Categories
Languages

HTML5 vs Native – What are the tradeoffs?

In our latest developer survey we asked developers who use or plan to adopt HTML5 why they do so and also what the technology needs to compete with native alternatives. The results show a tradeoff of increased portability and lower development cost against capability, in the form of reduced API access and a poorer development environment. In this scenario, the key to success with web technologies is taking advantage of their strengths in areas where their weaknesses are less of a handicap.

Developer Economics 2013 - HTML5 trades off native optimisation for portability and cost

HTML5 is becoming a viable alternative to native development across a number of app categories. We found that HTML developers mainly focus on specific app categories such as Business & Productivity (42% of HTML developers), Enterprise (32%) and Media apps (28%). On the other hand, Games are not a common category among HTML developers (12%).

We asked developers that use or are planning to use HTML about the reasons for platform selection. The majority indicated code portability as the main incentive for using HTML5. Low cost development is the second driving force for HTML5 adoption, highlighted by 51% of developers. HTML is still an “extension platform” in that only 26% of developers who use it consider it their main platform. We asked developers that use, have used or are planning to use HTML what they think HTML5 needs to compete with native platforms. Access to native APIs is a top challenge with 35% of developers indicating this as a critical success factor. HTML5 will always be a step behind in support for native APIs, given that cross platform tools and browser vendors will always have to implement support for a new API after it is released to developers by the platform vendor. In addition, the HTML5 development experience is subpar, with developers indicating that a better development environment (34%) and better debugging support (22%) are needed. More importantly, optimised HTML5 devices were not seen as important as the native API access or dev environment. This leads us to conclude that HTML proponents such as Facebook, Mozilla and Google should focus on cross platform tools and development environments on at least equal levels as they focus on full platform efforts like Facebook Platform, Firefox OS and Chrome OS.

[doritos_report location=’DE13 Article – HTML5 vs Native’]

Categories
News and Resources

The user analytics duopoly: Google and Flurry are well ahead of competition

Usage analytics tools usually have a very simple integration which enables developer to get basic information about their active user base – size, usage frequency, device models, OS versions and app versions in use. More custom integration enables developers to log events to the usage analytics platforms when users perform specific actions within the app. This allows developers to track which features or functions are most use, measure conversion rates and pinpoint where in UI flows users are giving up if actions are not being completed.

User analytics services gain in importance as competition intensifies

User analytics services are becoming increasingly important as competition in app development continues to rise. The ability to track how users interact with apps is extremely valuable for both developers and product managers and to some extent acts as a proxy for user feedback. The absence of a direct two-way communication channel between developers and users means that user analytics often provide the only channel from user to developer. 28% of developers use user analytics services overall, but usage rises with the number of apps developed, reaching 39% among developers working on more than 10 apps per year.

Analytics services seem to be significantly more important among iOS developers (used by 39% of iOS developers) compared to other platforms. This suggests that iOS developers take more interest overall in their user base, a fact that could indicate a more professional approach to development. Among the top platforms, user analytics tools are the least popular with BlackBerry developers (15%). BlackBerry has suffered high churn of its affluent user base and developers sticking with the platform are likely to be working on outsourced ports with little interest about the way that users interact with an app. Among the other major platforms around a quarter of developers use user analytics, with Android being slightly ahead (28% of Android developers).

DE13-19-01

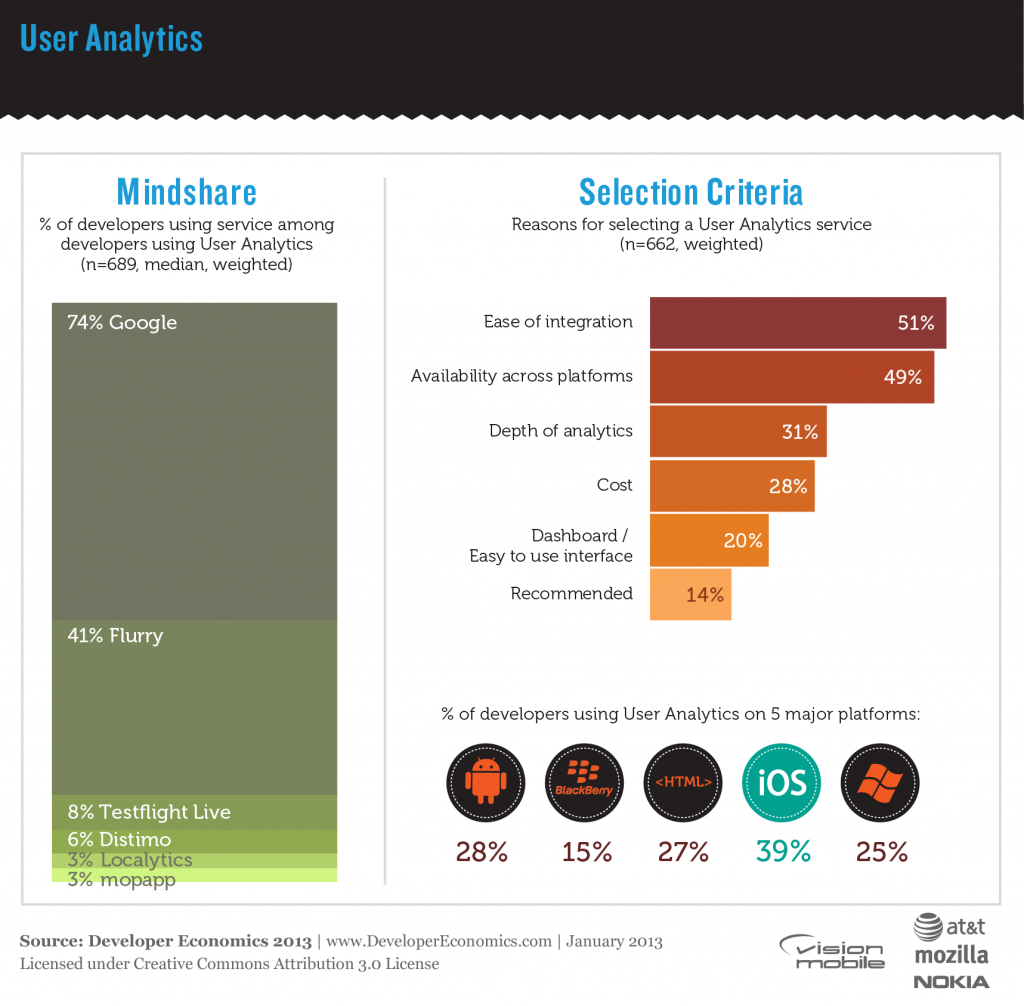
Google and Flurry lead the pack

The picture in user analytics services is quite telling with two services dominating: Google and Flurry. Google has traditionally been strong in web analytics but it has now extended its stronghold on to mobile platforms commanding a 69% mindshare among developers employing User Analytics services. However, its dominance is mainly observed among HTML developers and although it leads on Android, BlackBerry and Windows Phone, its lead is by a small margin. Runner-up Flurry, is used by 49% of developers employing User Analytics services but is the leading User Analytics service on iOS (64% vs. 58% for Google). Flurry, being one of the pioneers in User Analytics has grown into one of the heavyweights in app ecosystems, and is recognised as a de-facto analytics platform for developers. Beyond these two services, there are numerous smaller players vying for third place, currently held by Testflight Live, a service recently acquired by ad mediation service Burstly in a move that is quite typical of the synergies between different tools and services that drive consolidation in the marketplace.

User Analytics services are stronger in Media apps (News/sports/weather/magazines) as well as in Entertainment apps, used by 36% of developers working on such apps. However, they are more or less popular across all app categories, but less so in Education/Reference apps. Google analytics is stronger overall across all these categories, with the exception of Games where both Google and Flurry are equally strong.

Minimizing overhead is the priority

Developers opt for services that are easy to integrate within their apps or that are available across several platforms as indicated by 51% and 49% of developers using user analytics services. I.e. the main priority for developers is to minimise the overheads associated with using user analytics, while optimising analytics comes third: only 31% of developers using user analytics services are concerned with the depth of analytics, and only 13% are interested in real-time reports. Cost is a also deciding factor as pointed out by 28% of developers employing user analytics.

We asked developers using User Analytics services to indicate the number of active users of their most popular app. Excluding those apps that have more than 500,000 users, developers’ most popular apps have an average active user base of 56,000 users, although this number varies widely within platforms and across platforms. iOS developers indicated 70,000 users vs. 51,000 users on average for Android. The median user base, is 27,500 users for iOS and 15,500 for Android, indicating that while Android commands a higher market share, iOS users engage more actively with the platform when it comes to apps with less than 500,000 active users.

[doritos_report location=’DE13 Article – User analytics’]

Which user analytics tools are other developers using?


[toggle title=”Important things to know about this interactive graph”]

  • All the filters in the graph refer to survey questions in which respondents could select multiple answers. This means that there is no direct link between the filter and the use of the tool. For example, filtering on “Android” means that the respondents develop Android apps. It doesn’t imply that they use the tools for their Android apps specifically, or even that the tool supports the Android platform. Use filters as a guideline only.
  • Keep an eye on the sample size. If the sample size is low, the graph doesn’t offer strong conclusions about the popularity of different tools. Use your good judgment when making decisions.[/toggle]

    Find the best analytics tool for you!

    [sectors ids=’40’]

Categories
Business Tips

The Costs of App Security

The security features of an app are often ignored in the rush to get a new product to market. We naturally tend to focus more on what an app should do, rather than what it shouldn’t. Making sure that an app doesn’t have security issues is a difficult and potentially expensive process. Lately there is evidence that developers are trying at least to face app security costs issues. A recent post from our partners in DZone shows exactly this.

There are no automated tests to ensure user data hasn’t been left vulnerable. This goes for unencrypted passwords as well. Typically this requires a manual audit of the code and some form of penetration testing, with a skilled developer attempting to compromise the app. However, the costs of implementing security features and adding security testing to your development process are much smaller than the potential costs of a major security breach.

Problems with payments

For some types of app the consequences of this are more obvious. There are even standards in place to try to ensure a minimum level of security. For instance, any application which handles payment card details needs to process that data securely as specified by the Payment Cards Industry. However, PCI standards compliance is only audited for large merchants. Smaller merchants self-certify compliance.

If an app or service for a small merchant was compromised, resulting in abuse of payment card data, then any non-compliance discovered could result in significant fines or even liability for any fraudulent payments. Merchants who add interfaces to their existing payments infrastructure to support mobile apps need to be particularly careful. New attacks can be made possible when the payment authorisation occurs on a native mobile client, rather than a website.

Even for apps selling digital goods via in-app purchase there are still payment security issues to consider. Of course stakes are nowhere near as large. However, attackers can still impersonate the official store provider servers and simulate in-app purchases without any genuine payment.

Apple’s system was compromised in this way last summer. Another hack was reported for payments on Google Play just before Christmas. There is no link to this because, although it was only for rooted devices, we’re not aware of a fix in place yet. (Indeed it may even be a scam to get users to install malware).

Losing data can cost you even more

For enterprise app developers, being associated with a major security breach could mean the end of your business.

A harmful loss of data for a client could send valuable market data go to the competition, or even key employees. You would lose trust (and business)! If the breach is sufficiently public, you could lose the trust of all potential future clients as well.

The larger a company the more vital it is that they implement good security practices.

For consumer apps, leaking user data to attackers has direct costs. Firstly, in terms of service downtime whilst fixing security holes (usually in a hurry with the aid of expensive experts), notifying those affected and possible compensation. Secondly, there are serious indirect costs in terms of lost trust and users. Again here, the larger the user base, the more attractive the app is to attackers and the more serious any breach.

Invest in app security appropriately

Investments in security need to be proportional to the risks. How many users are involved and the value of data stored should determine the level of effort required to ensure that data is safe.

Not knowing about the security implications of your application is somewhat like driving without insurance.

Everything is fine until the unthinkable happens. Then it’s likely that lots of innocent people suffer and you get into a lot of trouble.

The technical details of app security are beyond the scope of this post. However, we have prepared a list of top 10 vulnerabilities and how to avoid them. Read on if your app deals with any user data or payments.

Categories
Business

How to Get App Ideas

How do you decide what app to build next? Paul Graham wrote an excellent post about the related problem of finding an idea for a startup. Paul says:

The way to get startup ideas is not to try to think of startup ideas. It’s to look for problems, preferably problems you have yourself.

The very best startup ideas tend to have three things in common: they’re something the founders themselves want, that they themselves can build, and that few others realize are worth doing. Microsoft, Apple, Yahoo, Google, and Facebook all began this way.

However, it should be noted that when Paul Graham says “startup” he does not mean any new company, only the hyper-growth variety that are often funded by venture capital. It should be noted that the vast majority of these companies fail. So, if you’re building a business around apps and are aiming your sights a little lower than “the next big thing” then our survey suggests that solving your own problems might not be the best option. 49% of developers build apps they want to use themselves, but end up generating the least revenue.

Beware survivorship bias

The following data should be interpreted carefully, some of the most successful strategies are only viable for larger publishers, or only available for those who already have a successful app – this creates survivorship bias. However, there appears to be a strong correlation between more carefully researched methods of deciding what app to develop and financial success.

Developer Economics 2013 - Successful developers grow by extending apps into countries and verticals

Business side of apps is harder than the technology

Almost half of developers (49%) in our survey decide which apps to develop based on their own needs. Those same developers end up generating the least amount of revenue per app per month, indicating that they have a lot to learn in how they plan their app business. Naturally, planning a business based on own needs may yield a good customer understanding, but lacks the rigor of market research or of extending proven app recipes into new countries or verticals.

User feedback is effective but hard to get

We find it remarkable that only 24% of developers in our sample plan their apps based on discussions with users, a figure which does not change with development experience or proficiency. This indicates that the bottleneck of the build-measure-learn cycle of lean development is the “measuring”, or listening in to user needs. This highlights the need for a frictionless 2-way feedback channel between developers and users, much like what GetSatisfaction pioneered for web apps, and which now HelpShift is pioneering for mobile apps.

Market research pays off

To decide which apps to build, a sizeable share of developers uses market research and competitive intelligence. Market research and competitive intelligence are well-established practices in business development and we expect that the increasingly business-savvy developer population will, in the near future, invest more effort in these elements when designing a product strategy.

Bigger publishers have more options

Developers that publish more apps per year tend to make decisions based on different criteria than those publishing only a few apps per year. For developers publishing 16+ apps, the decision mainly lies with clients or management – these are mostly professional developers that work on commissioned apps or as employees of larger publishers where the decision on which app to work on is mainly based on a defendable business case. Developers publishing more apps also tend to rely on market research more, whether that is purchased research or own research through app store monitoring and analytics services.

Build on success

The most successful strategies are those that extend an app into markets, either into verticals or different geographies. To some extent these strategies rely on an already established and successful business: these are apps that have been tried and proven in at least one market and are generally less risky options or “low hanging fruit” for developers.
[doritos_report location=’DE13 Article – App Ideas’]

Categories
Business

How Price Changes Can Improve Revenues

Distimo recently published an interesting report (free, registration required) on how app price changes affect revenue for iPhone & iPad apps. They give a breakdown on the scale of price changes but only give the really interesting results – the download and revenue impacts – averaged across all price changes. The key result is that download volumes and revenues are significantly positively impacted by price drops and negatively impacted to a lesser degree when the price rises again.

Although not specified by Distimo it’s likely that the vast majority of price rises are simply prices returning to normal after an offer ends. In this context it’s worth bearing in mind that e.g. an app with 1000 downloads/day increases on average to 9710 downloads/day after 5 days following a price drop. When the price goes back up again, the downloads fall by 57% of the increased total, e.g. back to 4175.

Demand at zero price

A factor that is not accounted for in the Distimo analysis is the discontinuity in demand at zero price. Ideally the effects of price changes that make an app free should be analysed separately from those which do not. In the former case, demand at zero price is typically multiples of demand at any non-zero price; a free promotion also relies on generating revenue from in-app purchases, advertising or subsequent increased demand after the promotion ends. On the other hand, price changes which do not make an app free are trading off price against volume. Developers can experiment with these changes to find the price point which generates maximum revenue. For most apps the marginal cost of serving additional users is close to zero and certainly dwarfed by the cost of creating the app. In this scenario, maximum revenue equals maximum profit. The zero price effect also suggests that any price drop intended to increase downloads for the purposes of increased visibility in the store should be a free promotion for maximum impact.

Longer term impact

The Distimo report shows revenue growth (purely from downloads and in-app purchases) continues for at least seven days from a price drop, reaching an average of 71% increase for the iPad and 159% for the iPhone. Beyond seven days we have a much smaller dataset from the App Rewards Club (and their analysis of Free App A Day) which suggests an initial revenue spike follows the end of a free promotion but the longer term increase in revenues is only minor, questioning the fees charged by some free promotion services.

Beware frequent sales

If a key component of your revenue model is paid downloads and temporary price drops create spikes in revenue, along with slightly increased revenue in the long run, it’s tempting to think that frequent sales will ratchet up your earnings bit by bit. The truth is likely the opposite since there are multiple services that allow consumers to check the price history of a premium app; if there are regular sales many users will simply wait for the next one. There was a good review of the issues with sales on the app store last year, however, ignore any claims that it’s impossible to succeed with premium pricing – even in the most competitive category, games, one of the most successful apps is MineCraft, priced consistently at $6.99. Most of the other top ranked premium apps either don’t have sales at all, or only do so around significant events (new major versions, holidays, new device launches).

All of this data was for iOS. According to Distimo, Google Play also shows similar effects on price changes but of a smaller magnitude due to the greater difficulty of reaching top rankings. However, the subject of price promotion on Android is much less relevant, since paid downloads make up such a tiny fraction of overall revenues.

Categories
Business Platforms

The Darker Side of App Store Optimization

As long as there are algorithms impacting revenues there will be people trying to game them. In the world of mobile apps there are two sorts of algorithm that can be routes to success, chart rankings and search rankings. Chart rankings are very simple and typically just use some time-weighted download volume. Search rankings are much more complex, involving keywords, reviews and other social or similarity-based data as well as downloads. Developers can use a range of tactics to improve their ranking in these algorithms, some of them much more legitimate than others.

There’s no such thing as a bad download

Whilst there are very good practices for optimising search ranking, such as using tools that monitor competitors and analyse their keyword usage to suggest improvements to your own, the single most effective way to improve all rankings is to increase downloads. For paid apps, all downloads generate revenue, whether the app gets used or not – temporarily reducing the price or making the app free is an effective technique for boosting downloads, which boosts rankings and subsequent revenue when the price is returned to normal. For apps that are free anyway, it can similarly be worth spending some of the revenue earned through advertising or in-app purchases to increase downloads. On one level this is obvious, it’s worth spending money to market the app and try to reach new users. However, the winner takes all nature of app store discovery at present makes it worthwhile for some developers to chase downloads purely to enhance their rankings. Even users who will never open the app are worth attracting if they can be acquired for a low enough cost.

Paid placement

There are lots of advertising options available that drive users to your app in the store. The vast majority of them are pay-per-click and thus cannot be used cost effectively to inflate downloads of an app that doesn’t generate significant revenue per user anyway. Most of these are clearly advertising products, others look like app discovery tools to end users. Hooked is a good example of an app that blurs the line between discovery and advertising. They have a popular social discovery app for Android games where developers can pay to generate installs. For developers this is a very logical option because they have a fixed cost for installs which they can compare against average revenue per user. On the other hand, users may believe they’re getting a recommendation when in reality they are seeing an advert. It’s the same argument that surrounded paid placement for search results in the days before Google launched AdWords.

Cross Promotion

Another way to reach users is through similar apps. Apps promoting one another is a great way to reach a common user base. There are several cross-promotion networks with a variety of business models. Ironically the one with the name most suggestive of ranking manipulation, Chartboost, is at the most ethical end; they provide completely free technology for developers to organize their own cross-promotions and also a marketplace to connect developers where they take a cut of the transactions. At the same time, the most popular cross-promotion network (according to our latest survey), Tapjoy, plays much closer to the lines of acceptable conduct. One (and in fairness it should be emphasised only one of several) of Tapjoy’s services is incentivised downloads, a practice that Apple have repeatedly cracked down on – they pay users (in virtual rewards such as in-game currency) to download apps which have paid for that service (in cash). Clearly a large fraction of people who will download other apps to earn a bit of virtual currency are those unable or unwilling to pay for the same. These users almost by definition are unlikely to monetize, so the only obvious reason to seek them out is to increase rankings in order to be discovered by other paying users that would be more expensive to reach directly.

Shuabang!

At the extreme end of ranking manipulation, with no pretence of being anything else, is Shaubang. This manipulation is primarily practiced on Apple’s App Store, made possible by the fact that a credit card is not required for an iTunes account in China. Companies with millions of accounts make use of extremely cheap local labour to pay people to download and review apps. These services often guarantee to boost an app to a desired category ranking for a fixed fee. This practice is heavily frowned upon by store owners but also extremely hard to police, since it involves real users (sometimes bot-assisted for efficiency) with real accounts.

Where’s the harm?

Users are mostly getting what they want out of these deals and so are the developers involved. Store owners have higher download stats to boast about. Even at the extreme end we have job creation in China. The main people losing out are the developers not taking advantage of these strategies. However, if ranking manipulation becomes the norm rather than a fringe behaviour then two problems become very serious. First, the top ranked apps are simply the ones that paid the most to be there, rather than the best ones – this makes discovery of genuinely great apps harder and reduces the overall perception of app quality. Second, a feedback cycle further concentrates revenue at the top of rankings – only those who pay to be at the top can afford sufficient manipulation to stay there and the rankings will begin to stagnate. App store owners need to ensure their markets are as honest and fair as possible, or users and honest developers will suffer in the long run.