Categories
Tools

What have developers been reading

While novel readers were busy paging through murder mysteries and historical fiction this past spring, developer interests were data and analytics, Jakarta, cloud-native articles, Kubernetes and open source.

That’s what we discovered when we took a look at quarter-over-quarter pageview trends in DZone.com. A little background: 29 million unique readers visit each year. The research is based on article tags assigned by DZone editors and used to help readers search once they’re on our site. They aren’t keywords.

Consuming All Things Data in the Data Category

Our first pass researching tags occurred in the first quarter, when interest in data analytics and tools articles skyrocketed. Same situation for Q2 vs Q1. Our findings did show that readership shifted away from the data scientist tagline toward specific tools and data strategies that anyone can implement.

Q2TopicTags_2

Of the fastest-growing data analysis topics, the data analysis tools tag grew over 30X, and related topics like ingesting data (the collection of data into/out of the database for immediate use) and augmented analytics (machine learning-powered data analysis) grew about 10X more popular with readers.

Terms like ingesting data and augmented analytics speak to the need for more than just a dashboard approach to consuming data. Tim Spann, a Big Data thought leader and field engineer at Cloudera, thinks a consolidation in analytics is underway.

“I think there’s going to be consolidation. And a lot of startups are going to try to integrate a couple of these things together. They’re going to try to add more features and differentiate themselves. You’re going to see more of the data analytics tools try to do ingest and vice versa, (so) they’ll be a more interactive platform,” he explains.

“You’re getting more data, you need to be able to ingest, you need to be able to analyze it, you need to be able to build apps out of them — it’s not just enough to have a static report, or even a dashboard that people look at, people actually have uses for this data.”

From Java EE to Jakarta

After Oracle announced in 2017 that they were handing over Java EE to the Eclipse Foundation, a few changes began to take place. One was that Enterprise Java would now be called Jakarta EE.

In the second quarter of this year, the Eclipse Foundation announced that all Jakarta specifications with “javax.*” must be changed to “jakarta.*” This had the potential to significantly impact, and potentially harm, existing Enterprise Java applications.

It’s no surprise that developers were on DZone searching for the best ways to comply with these changes. We saw a lot of growth in all related topic tags, including Enterprise Java, which grew 10 times more popular, and Jakarta, which grew over 35 times more popular in Q2.

Apps and Cloud-Native Development

Cloud-native development is drastically changing the way we build applications. The term cloud-native refers to a style of container-based development that creates applications from scratch, or refactors older applications, to be fully optimized for the cloud. This is very different from older application development philosophies that retroactively adjusted apps to be cloud-enabled using methods like lift-and-shift or re-platforming.

According to this article on what it means to be cloud-native, the applications contain three major traits. They are container-centric, dynamically managed (i.e., containers are managed and organized by Kubernetes or other similar platforms), and microservices-oriented.

From Q1 to Q2, many aspects of cloud development showed steady growth. However, topics specific to cloud-native development grew exponentially, with the term itself showing over 300% growth last quarter.

Related tags that also showed an increase included:

  • Cloud-based microservices (500%)
  • Cloud-native deployment (140%)
  • Scaling microservices (160%)

Q2TopicTags_4

“The cloud-native ecosystem will see explosive growth as the growing adoption of Kubernetes will translate to a growing need to make it manageable for the enterprise. There are both huge gaps in tooling and many unrealized opportunities in making fleets of microservices more manageable — and we expect to see projects sprout up to handle both the gaps and the opportunities,” said Gwen Shapira, Data Architect at Confluent, in this interview with DZone.

Is Kubernetes the King of Development?

Kubernetes is the largest cloud-native platform designed to manage, scale, and deploy containers. As cloud-native development continues to grow, so does interest in Kubernetes.

“Kubernetes is a game changer. It’s slowly taking over the way the Internet works as far as application development and deployment,” explains Bob Reselman, an industry analyst and technical educator.

“It’s all changing so fast. Every five years, the stack is changing. Because of this, developers are finding themselves in a constant state of adaptivity and looking for the next best tool and ways to manage, scale, and deploy applications.”

Not surprisingly, we found topic tags related to Kubernetes and Kubernetes deployment showing tremendous growth from Q1 to Q2, including:

  • k8s — another name for Kubernetes (7X more popular).
  • Kubeadm — a fast-path command for creating a Kubernetes cluster (151%).
  • Kubelet — a command that runs individual Kubernetes nodes (118%).
  • Kubernetes services — rules and abstractions for Kubernetes pods (85%).
  • GKE — Google Kubernetes Engine (66% growth).

Open Source Topics Remain Popular Developer Interests

Nearly all of the above-mentioned topic tags contain one common theme: Open source.

The open-source topics that saw the most growth include:

  • Open APIs (11X).
  • Open source big data tools (200%).
  • Open source communities (110%).

Additionally, we saw growth in a wide range of open-source tools and platforms — some mentioned above, like Kubernetes, Apache, Jakarta, RSocket, and many more.

As the stack continues to change and evolve, developers will seek out open-source software first. Without question. Kubernetes, data tools like Apache Spark and Kafka— all open source, all dominating the ecosystem and rank high in developer interests.

Q2TopicTags_6

“I believe enterprises will increasingly turn to managed platforms delivering 100% open-source technologies in 2019, as they increasingly seek to avoid the vendor and technological lock-in that remain too common with proprietary open source offerings,” explained Ben Slater, CPO at Instaclustr, in an interview with DZone late last year.

“Given the fact that commercialized open-source technologies can leave enterprises at the mercy of price increases (and make it impossible to run solutions on their own or implement useful modifications), fully open-source technologies offer a compelling alternative.”

“Open-source solutions are empowered by engaged communities that help ensure rapid improvements and bug resolution, better security, full transparency and reliability, and a faster time to market at a lower cost.”

About the author:

Lindsay is a Content Coordinator at Devada. She works closely with contributors to DZone, a website for software developers and IT professionals to learn and share their knowledge. Editing and reviewing submissions to the site, she specializes in content related to Java, IoT, and software security.

Categories
Business Tips

[Infographic] How to design a growth strategy for your app.

Developers are makers. They solve pains, entertain, enlighten, and enhance productivity. Building an app can be an exhilarating experience and the joys of shipping can linger for… about ten seconds. Then comes the question: “I’ve built an app, now what?” Where do you start with your app growth strategy?

Building strategies for user acquisition and retention are the two major tasks for dev teams after they have built an app. Analytics helps understand exactly what is happening and how to keep building traction. From there, new possibilities can emerge that will help you grow your user community even stronger and help you identify novel ideas that may offer you a winning edge.

Check out our infographic based on our series of articles on User Acquisition , User Retention and Growth Analytics.

Built_an_app_Infographic (3)

Want more insights on app growth strategy?

Check out our State of the Developer Nation Reports, and make sure you understand Analytics for Growth.

Categories
Business

You’ve Built an App: Now What? Part 3: Analytics for Growth


analytics_growth

Like many developer teams that have released an app, Ægir Thor Steinarsson and Anne-Marthe Lorck (creators of the BudUp app), are now working on the next two goals of app creation: user acquisition and retention.

Steinarsson said that right now, he is “laying the groundwork”: setting up databases and spreadsheets to track what is happening. “I am taking a scientific approach to it: everything will be calculated. You need to Excel the shit out of this! I am using Google Analytics with collection points like counting every time users download the app, where the users are coming from. We have this set up but haven’t really started using it, but will in the near future. This is a learning process for us, so what is most important is measuring the traction channel. We’re very focused on collecting information.”

The Core Apps Analytics Process

Caroline Ragot, co-founder of Women in Mobile and a mobile strategist at Schibsted Spain, described the complete process for new dev teams when setting up their analytics:

“The basic tool is Firebase. It’s easy to integrate but isn’t as powerful (as paid options), but it is free and the others are not cheap but very powerful.” Ragot said Firebase is one of the most powerful free analytics tools available, especially if it is combined with Google Analytics. Firebase has been designed especially for mobile analytics and Ragot believes Google will keep investing in making it better. She also pointed to Flurry Analytics, which has a free component. Like many developers, Ragot focuses on Android apps first. According to VisionMobile’s Developer Economics State of the Developer Nation bi-annual report, 47% of professional developers consider Android their primary platform.

“If you start doing acquisition, you have to start tracking everything.” She suggested using AppsFlyer or Adjust. “Track everything that you promote, for each campaign for Facebook, you can have a separate link so you can see each specific campaign and how many downloads it gets you.”

Ragot said it is essential to go beyond downloads and track events to see how users from each traction channel are actually using your app. For example, for a job search app, you would want to set up event tracking for signing in, editing a CV, or applying for a job. “That way, you can see the quality of the campaign and whether the download users are doing something in the app. For example, 50 out of 100 downloaders might sign in coming from one campaign, and in another channel, 200 downloads are done but only 20 of those actually sign in to the app, so the quality is actually not so good so you can decide how to invest your money. So track everything with AppsFlyer and Adjust.”

Ragot said once analytics is in place, it is possible to start looking at the data and making sure your funnel is right. Each app has its own engage and customer funnel. For example, for Steinarsson’s BudUp app, the funnel involves creating an event, and attending it with other users who are looking for social company. For e-commerce, the funnel is selecting a product and going through the shopping cart to buy it. For an image manipulation app, the funnel is to add a filter to a photo and share it on social media or publish it.

Ragot said that over time, each step in those processes needs to be included in Google Analytics, so that dev teams can analyze when a user exits without completing the process. “Look at every step. Where do they drop? Was it a UX problem, that is super important. Analytics is for making sure your product is working well. How many downloads and users you have is really vanity metrics,” Ragot warned.

Brenden Mulligan, who is currently working on the app platform Firebase, is the former LaunchKit founder, which was recently acquired by Google. He listed a range of tools that he believes should be the bedrock of an app team’s analytics process. “Listen, learn, listen, learn,” he encouraged. “Analyze user behavior with analytics tools like Firebase Analytics, Mixpanel, or Fabric Answers. Make sure your app quality is strong with monitoring tools like Firebase Crash Reporting or Crashlytics. See what users are saying on the App Store with LaunchKit Review Monitor or App Figures. Set up communication channels through Intercom or Zendesk. Track any press mentions with Google Alerts and keep track of what people are saying on social media. Do A/B testing of different on-boarding flows and critical user journeys using Optimizely and Firebase Remote Config.”

Selecting Key Performance Indicators (KPIs)

Steinarsson said he is interested in two metrics at the moment:

  • Active users vs downloads (“That will be bad now, but we need to set a base”), and
  • Measuring each acquisition channel (“for example, measuring referrals from blogs or from Facebook ads”).

Ragot said new dev teams can even just focus on one metric: “If there is one KPI, according to my experience, that tells you everything, it is “Retention at Day X”. D1 retention is how many people come back to your app in the same day after they install it. I am always looking at D1, D3, D7, D14 and D30. If you put all of your effort into measuring this, you have good analytics that is a mix of retention and acquisition.”

Thinking Outside the Box

For Steinarsson and his cofounder Lorck, one of the biggest journeys since releasing their app has been the need to shift mindset from developing an app to running a business. “The greatest challenge has been moving away from being an amateur building something and being someone who runs a company and all the skills that go with that,” said Steinarsson. “Now it is out there, there is no hiding anymore and you have to acquire the skills at lightening speed, so that transition is the greatest challenge for me at the moment. Luckily, I have people who are working with me: for almost a year, my cofounder and I have been working together. She understands the pain point we are addressing, so she corrects me when I go off course. I can’t stress enough the importance of working together in a team.” He mentioned having a separate web designer and someone doing content generations for videos, and other outlets as an example of building his team.

“Mobile marketing is a discipline which is creating itself, and is still in process of creation,” explained Ragot. In the same way that once upon a time we would say “webmaster” and think of one person, now we all agree that it would be crazy to have one person managing content, social media, backend infrastructure, API developers, community engagement, and all of the other roles that are required for a scalable, growth-focused web business. It is the same for mobile, she said. As an app grows in its usage, the rest of that team needs to fill out, and everyone has a role in keeping on top of new developments, or testing new ideas.

“It is crazy to think you can have one developer do everything for your mobile app,” cautioned Ragot. “To me, a good developer has to know the 360 overview and what are those other expertise and how they work together but doesn’t need to know everything.”

The beauty of growing that team means that new ideas can spring up and new techniques to encourage user acquisition and retention. Ragot says that as an emerging industry, there are still new methods that have great opportunities for app developers. While Facebook Ad campaigns are now a mainstay in mobile marketing — with cost per acquisition now reflecting a high level of competition — other techniques are still available to savvy dev teams.

“App indexing is the new trend that not many people are using,” Ragot suggested. This requires both a website and mobile app for now although there are plans to make it available for app-only sites. Ragot says the technical integration is not easy, but the idea is that if you have the same search interface on both web and app, then users can open your website on their smartphone browser and when carrying out a search on your site, they are automatically directed to download your app, or directed to automatically open your app and carry out the search there if it is already downloaded. “It is still not fully used, whereas Facebook campaigns are now overcrowded and everyone knows that is the easiest way to get paid acquisition. App indexing is a great way to get organic acquisition — which means free downloads.

Building strategies for user acquisition and retention are the two major tasks for dev teams after they have built an app, and analytics helps understand exactly what is happening and how to keep building traction. From there, new possibilities can emerge that will help you grow your user community even stronger and help you identify novel ideas that may offer you a winning edge.

The strategies listed here work equally well for Android, iOS and Windows mobile apps, but for many developers the need for analytics tools to integrate with the Android platform is of paramount importance. According to VisionMobile’s  Developer Economics State of the Developer Nation  bi-annual report, Android has 79% of mindshare amongst mobile developers and is dominating as the mobile application platform used by professional developers. Based on surveys with over 16,500 developers across 145 countries, this latest study from VisionMobile shows how developers are building apps and thinking through solutions for mobile, desktop, IoT and emerging technologies including VR and Machine Learning. 

We are currently running our new survey and it is sci-fi themed! Would you like to contribute ? Take the survey 


Categories
Business

You’ve Built an App: Now What? Part 1: User Acquisition

user acquisition

Developers are makers. They solve pains, entertain, enlighten, and enhance productivity. Building an app can be an exhilarating experience and the joys of shipping can linger for… about ten seconds. Then comes the question, “I’ve built an app, now what?”

“Building an app is incredibly hard,” said Brenden Mulligan, former LaunchKit founder, which was recently acquired by Google. “But getting people to use it is an even bigger challenge. Once an app is released you start getting so many signals of how it’s doing, and it’s important to have the right infrastructure set up to receive and learn from those signals. Things like user activity, app store reviews, churn… In addition, devs have to be thinking of the next feature, or bugs they need to fix.”

Earlier this year, Ægir Thor Steinarsson and Anne-Marthe Lorck built an app to resolve what they were seeing as a common pain point.

“I am a fairly introverted person, and I am a bit disconnected from social groups: I’m studying with people much younger than me, I live in a foreign country. I mostly felt content in my day to day life, but also that I was missing out: I would end up repeatedly cancelling stuff I did want to do, like go to a concert or even a museum, because I didn’t know who to invite,” said Steinarsson.

“We did interviews with about 40 people and found others were experiencing social isolation as well,  we asked people to give it a pain grade on a scale of 1 to 5 and we started seeing everyone giving it a high pain point (3 and above). That turned out to be the main theme rather than the exception.”

Steinarsson and Lorck created BudUp as an app to solve that: users can register an event (a concert, movie, dinner party or other activity), and specify the number of people they hope to attend with.

The app was released on the Google Play Store. Android is the main mobile platform for professional developers, according to VisionMobile’s State of the Developer Nation quarterly report, which found that Android accounted for 79% of mobile developer mindshare.

For the BudUp team, while they have plans for an iOS app, for now their focus is all about traction: to get user downloads. As they ramp up their user acquisition, Steinarsson wants to make sure he has data systems in place to know what is happening and to monitor the user experience.

Knowing what to measure and using the free tools that can help developers do that quickly is crucial, said Caroline Ragot, Co-founder of Women in Mobile and Mobile Strategist at InfoJobs, a company of Schibsted Spain.

Ragot says there are two tasks to focus on after building an app: the first is acquisition, which is really about marketing an app.

The second task for a new app is to focus on retention. Ragot says retention is about marketing and the product working together. Analytics underpins an understanding of both these tasks.

Focusing on Acquisition: App Store Optimization (ASO)

Increasing user acquisition for your app starts with app store optimization. 30% of downloads occur after someone has searched by keywords in Google Play. So getting noticed within the app marketplace can already drive up user downloads before looking at any other type of promotion.

Ragot says there are three components in app store optimization:

  • text
  • icons
  • Screenshots
  • Review and rating.

Building off the experience of websites in getting noticed, app store optimization makes an impact. Ragot suggests thinking what people will search for when looking for your app, and making sure that those keywords are included in the application title text. “Put the keyword close to your brand,” said Ragot. “When I have done that for app projects, within about two hours I have seen apps move from a ranking of 30-something to a ranking of 8.”

After ASO, the next task is to make sure your icon looks appealing. Don’t believe this is important? Ragot suggests doing a simple app search for something like ‘clock’: “You will see that there will be some you don’t want to download just by looking at them.” In the Google Play console, there is a function to allow developers to A/B test their icons. Ragot suggests testing several and seeing which icon design drives more downloads for your app.

Screenshots are also important. “It’s like the landing page for your app. When visitors arrive, they need to understand what your app is about and it should inspire them to download. It is your first touchpoint with a user,” Ragot explained.

Finally, reviews and ratings make an impact. App stores like Google Play use metrics of downloads and active users as part of their search ranking algorithm, and reviews of apps makes a significant impact on helping encourage searchers to download.

Organic and Paid Acquisition

“The two big acquisition buckets are organic and paid,” said Mulligan, who recently talked about how to optimize app launches with First Round. “Ideally, an app can attract users organically. To do this, there are a lot of ways to optimize a launch to be more successful in initially attracting users. You need to make sure your product name is short and your tagline is clear and concise. You need to figure out what good acquisition looks like for your product and track it from the beginning. You need to bake in marketing hooks that let users share with others how they’re using your app and invite their friends to join them. When the time is right, you need to target the relevant reporters to cover your product and post it to sites with good lead generation like Product Hunt. And the whole time, make sure your line of communication with your early community is very open so you know what’s working, what’s not, and how to change your product to boost your acquisition.”

Other acquisition ideas include Facebook ad campaigns, which Ragot cautions can be expensive, but suggests it is still a good idea to dedicate a small budget of a few thousands dollars to encourage initial traction. Ragot also suggests focusing on social media by encouraging downloaders to share that they have downloaded your app and encourage their networks to do the same.

Steinarsson and Lorck will next focus on content marketing: getting featured in blogs, in particular. They believe when starting to acquire users it is important to do things that don’t necessarily scale in order to maintain an initial personal contact with potential users. They will target several content domains and see in which ones they get traction and focus on those segments to start.

When starting with acquiring users, it can feel like everything is an opportunity cost: choosing one strategy means not investing in another. Setting up analytics to quickly identify what is working is crucial to being able to do more of what works and quickly identify where effort is wasted. Ragot, Mulligan, Steinarsson and Lorck all agree: setting up analytics for acquisition and retention is essential.

And while their strategies are universal across mobile platforms, all three have focused on how to build acquisition with an Android app, reflecting the dominant position of Android in the mobile app developer’s mindshare. According to VisionMobile’s State of the Developer Nation report, 80% of those building apps professionally target Android.

In our next part, we will look at how to retain users once they have started using your app and in part three, we examine what analytics techniques for acquisition and retention to have in place and what free tools to use.

We are currently running our new survey and it is sci-fi themed! Would you like to contribute ? Take the survey 

Categories
APIs

What the logs don’t tell you

In a world that is increasingly dominated by mobile applications and cloud services, APIs are becoming crucial to developers and service providers alike. But what are developers actually getting? And is this what service providers think they provide?

error-logs

Developers

Developers want to use APIs that extend their service without having to either build the technology themselves or comply with required legislation or security (think payments or anything to do with storing large amounts of personal details).

[tweetable]Developers want simple, scalable, well-documented APIs that are as reliable as possible[/tweetable]. They do not want API they use to make their service unreliable, buggy or slow, i.e. make them look bad. Poorly-performing APIs can harm a developer’s reputation but also the API provider’s, should the branding of an API be visible to the world (think Twitter, Facebook, Instagram).

API Providers

API providers grant access to a service or services through the use of public or private APIs; a private API being a service that is not for public consumption for privacy or security reasons. Why grant access at all? To allow developers to use services and functionality that they do not have to build themselves and provide stickiness to an existing user base. Salesforce has done an amazing job of allowing third-party developers to use and extend the functionality that is provided and has even allowed developers to build a thriving apps and plugin community.

API providers look to balance the load on their servers that may also be dealing with other services. They are trying to provide minimum response times whilst maintaining the access and integrity of the data and the service for the developers.

Schrodinger’s API, it both works and doesn’t work at the same time

Here lies the problem; when an app that relies on an API performs badly whose fault is it? Is the app performing how the developer expected or is the API not responding and thus slowing the service? I[tweetable]t is very easy for the API provider to believe that just because the green light is on that the API is working[/tweetable]. Many systems behave completely different from the theoretical under load, when exposed to extreme conditions or elements beyond normal operation or even users doing unexpected things to the API.

Logs

System logs, either from servers, application monitoring tools or other conventional developer operating systems are excellent at hiding things because there is usually a lot of data to digest and identifying the issues from the noise can be nearly impossible.

Some examples include:

Averages – Whilst an average latency of 300ms may look ok its not if you are still getting a number of calls that take 10 seconds. To understand whether or not your slow performaning outliers are an issue means you have to look at the distribution of latencies and the frequency of the outliers.

Errors rates – hopefully these are low. Even a low error rate in a popular API can represent a huge issue. Consider an API that deals with 2 billion transactions a day at 0.2% error rate still has 4 million failed calls a day.

Logs only measure calls – If the API is not frequently used then the logs are not going to tell you anything. If the bulk of transactions are say only done on a Friday but the services failed on a Thursday then the detail will not be in the logs. Only frequent monitoring will notify you of issues before they hit your users.

Basically what the logs don’t tell you is how APIs work end to end, in different geographic regions and what the end-to-end latencies are when using real transactions.

Some simple rules

Monitoring is for life not just for Christmas.

An API that is switched on may not stay on but may be on every time you check.

The reliability of an API is inversely proportional to the number of people using it and the number of developers trying to do things that may break it.

The use of server logs is a function of user base and the amount of data being recorded.

Test the API like it would be used in the wild, end-to-end across a range of cloud services and apps. In this instance cloud services means hosting platforms like Google Apps Engine, Amazon Web Services and Azure to name a few.

Key question to ask is whether the servers are being tested for performance or the API and the impact on users and the overall experience?

As a developer and a user of services it’s the experience that matters. Poor experience equals poor brand perception, which leads to trying a different API or app, losing the client whether it’s a developer or a guy with an iPhone migrating onto the next app.

Things to consider when testing

Where is the data being served and where are your users?

An app that works in San Francisco when the server farm is in Mountain View may show differences when the same server farm has to serve the app in Europe. Test the API from different locations.

I got a HTTP200 response that means everything is fine, right?

Whilst most of us have seen HTTP 404’s, page not found, we also know HTTP 200 indicates an OK response from the server. The challenge comes from when a HTTP 200 means that things are not OK. For example, in order to avoid browser problems, some APIs only return HTTP 200 with an error message which needs to be parsed. Alternatively, the API might be returning invalid content which could cause an App to fail.

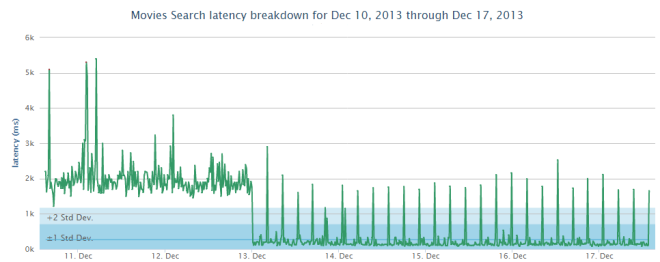
API search function comparison

facebook-vs-twitter-latency

In the above figure it can be seen that the average latency for search using the Facebook and Twitter API is approximately 2 seconds apart with Twitter being the faster and less erratic. Whilst we can only guess at what is happening in the background the reality is Facebook Graph Search appears to be less responsive to anyone using this feature in an app.

Regional server response variation

facebook-api-geo-latency

The above figure shows Facebook Get response across 6 regions globally. It can be seen that Asia and particularly Japan are poor cousins when it comes to regional performance. This behavior has been viewed with other APIs that have been tested in this way.

Caching data

search-caching-impact

The above figure shows the effect of caching on server response. After caching was implemented on the server it can be seen that response improved, even during refreshes (the spikes) overall performance was up.

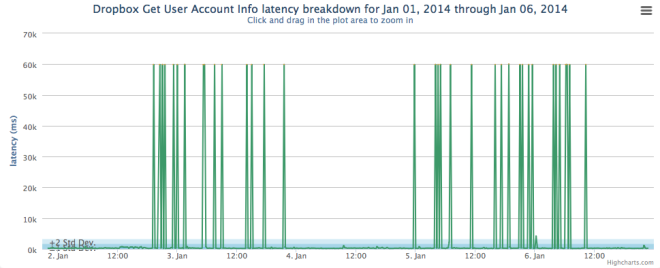
Server issues

dropbox-api-latency

The above figure shows intermittent server issues over time. This can be indicative of load balancing issues or a problem with a server in a server cluster.

What is the future?

[tweetable]The number of APIs is only going to increase and developers are likely to rely on 3rd party services more and more[/tweetable]. It is also likely that more than one API from more than one provider will be used in an app. How can we mitigate against the response of one API compared to another? We see a need for intelligence in the app that can let that user know that something may be awry with the service trying to be accessed. This should be utilized as part of the UI flow to warn that ‘hey looks like is not responding, please bear with us’. This would be enabled by pinging the monitoring service to determine if there are any issues reported or the app being alerted automatically on a fail scenario that is outside pre-determined boundaries.

Intelligence in the monitoring will also lead to better understanding of the results and give a heads up to the API providers when issues occur or when the data is showing that a server is about to fail and allow providers to avoid downtime.

Disclaimer: Data was provided by APImetrics.io who focus on API Performance measurement, testing and analytics. John Cooper is advisory board member at APImetrics

Categories
Tools

Why Developers Should Embrace User Analytics

In our latest Developer Economics survey we were really surprised to see a dramatic fall in the level of adoption of User Analytics tools. A year ago they were the most popular category of third party tool with 38% of mobile developers telling us they used them. This time, only 21% of developers said the same thing. Why has there been such a significant drop? Are the hordes of new developers flocking to mobile just unaware of what’s available? Is all analytics being tainted by the spying scandals? Why does it matter?

user-analytics

The new mobile developer tsunami

At WWDC this June, Apple said that they’d gained almost 50% more developers in the last year. The vast majority of those will be iOS developers (rather than OS X and Safari). Android has been growing even faster in terms of new apps, so it’s likely there was even greater growth in the mobile developer population there. Windows Phone also saw significant growth in developer adoption. With so many new developers getting started building mobile apps we’d expect that they’re not all aware of the tools available to help. However, the reduction in user analytics adoption was greater than for other tools, indeed some tools categories saw increased adoption. So, although lack of awareness is clearly a contributing factor it’s not the whole story.

Tracking behaviours, not people

Information on government spying activities leaked by Edward Snowden has turned sentiment amongst many of the technically aware against digital surveillance. Perhaps some developers feel they shouldn’t be spying on their users’ actions? [tweetable]Does adding analytics to your app violate user privacy? Not usually.[/tweetable] User analytics tools are primarily for examining correlations between user behaviours and changes in the product or its marketing. If you make changes to a sign-up screen you need to see if it improves the fraction of users who sign up. If you’re trying to convert free users into paying users, it’s vital to analyse which changes in design or pricing result in greater revenues. Even to improve a paid up front or entirely free app, understanding what users do when they’re using it is incredibly valuable. As long as you’re not collecting personally identifying data and associating it with activity then it’s hard to see this as spying. Even segmenting users for behavioural targeting of functionality or advertising seems harmless as long as they’re anonymous. When analytics providers aggregate data across apps to build up user profiles for advertising, that may cross the creepy line for some. If this bothers you then choose an analytics provider appropriately, or collect your own data. If it doesn’t then having a privacy policy that clearly states who sees what data and what it’s used for is the responsible thing to do.

Coding blind

[tweetable]Updating and iterating on apps without analytics is apparently incredibly common[/tweetable]. It’s unlikely that all of these developers are regularly running user testing panels to get detailed feedback. Is everyone coding blind? To avoid constant app updates which would annoy users (and not even be possible with the review cycle on iOS) developers need to include multiple changes in every new version. If user sign-ups or revenue goes down after an update, how can you tell what went wrong? If things improve, which changes helped? Which parts of your app do people use the most? Are you working on improving features that no-one is using anyway? Without some kind of analytics, how do you find the answers to these questions? Might you be wasting a lot of effort?

Just integrating a third party analytics tool isn’t enough to answer these questions either. Apps need to be instrumented to log analytics events for every major action in the application and how long users spend on various activities. Beyond that, to really understand the effects of changes, users need to be analysed as cohorts – groups that started using the app around the same time. The value of an app to its users may increase or decrease over time and users who have got used to a UI are more likely to be unhappy with any changes. For an app that’s just starting to grow a user base, a change that causes it to lose 10% of existing users might still be positive if it increases revenues from new users. To know the real effects of some changes, it’s necessary to analyse specific sets of events as funnels. For example, in a registration or purchase process, increasing the number of people that start the process is no good if the number that end up completing it is reduced because they feel misled.

Tool choices

Developers that decide to embrace analytics have a lot of choices, however, the market is quite polarised. By far the most popular tools are Google Analytics and Flurry. These are (mostly) free. Google Analytics has the advantage with Android developers because it is integrated with Google Play, allowing direct tracking through the acquisition and download process into usage. It does have a (very high) limit on usage. If your app gets incredibly successful you’ll have to use the premium tier, which has a flat annual fee of $150k. Flurry on the other hand is free at every scale, although not as advanced as Google Analytics in terms of segmentation, funnels and visualisation of data. Both services are collecting data across apps, effectively to sell to advertisers.

There’s also a premium-only market with better support for cohort analysis, funnels, segmentation and visualisation. Paid offerings also link the analytics direct to actions, allowing automated real-time messaging to users, or the sending of push notifications to specific groups. Mixpanel and Localytics are two examples of tools in this space. These premium tools are also designed to be a lot more usable by non-technical staff, allowing a marketing team to analyse and react to analytics without always needing help from the development team. These tools have a fairly low user or datapoint count for a free tier and then start charging hundreds of dollars per month for successful apps. However, this means that they don’t sell the data from your app to anyone else.

A third option is the relatively little known Amazon Mobile Analytics solution. So far it’s relatively basic on the analysis front and doesn’t have the prettiest interface. However, you can collect 100 million events per month for free and beyond the free tier it’s just $1 per million events. By contrast, Mixpanel charge $2,000 per month for 20 million events. Amazon don’t share your data with anyone or report on it (no word on whether they use it internally for their own purposes).

Give it a try

Thinking about your apps as places to experiment and measure how the users react takes a change of mindset. If you’re not just building apps for fun then this shift can make a massive difference to your success.

If you’ve had a major change in results because of something you discovered using analytics, share your story with us in the comments.

Categories
Tools

Users Are People Too: The Key to a Successful App is Knowing Your Users

Given the staggering odds against the success of any app in the marketplace, it is surprising that so much effort is devoted to the creation of apps, many of which never see the light of day.

Today, there are over 1.2 million apps in both Apple’s App Store and Google Play, of which just 500,000 are ever downloaded. Out of the 500,000, 20 percent are only opened once in the first 6 months after download, and almost 50% are used no more than 5 times.

brains_thumbnail

Growth hacking relies on incomplete data

With very few exceptions, pure word-of-mouth and organic growth without additional effort on the developer’s part is not enough for an app to surface above the noise. As a result, an entire cottage industry of “growth hackers” has emerged, one which takes traditional marketing approaches and combines them with rigorous metrics to make sure that every step of the process is measurable and actionable. For example, Quora closely monitored the behavior of their most active users. They found patterns that were used to stimulate other users to behave in the same way.

[tweetable]One of the limitations of the growth-hacking approach today is that the mobile ecosystem is still a Wild West[/tweetable], similar to where the desktop software industry was some 10-15 years ago. The most established mobile tools, such as Flurry and Google Analytics are really good at telling developers how users are using the app… which version, operating system, for how long a user engages in the app, which buttons are being pressed, etc… but do little to tell you anything about the wants and needs of the people using the apps.

While these descriptive analytics are critical, there is another piece of the puzzle for creating a successful app, which has been undiscovered by developers today: human understanding.

Human understanding is defined as the knowledge about a user’s demographics, interests, and intents. While tools like Flurry and Google Analytics are starting to provide more of these user insights, they are typically presented in aggregate form, which makes a user hard to understand on an individual level.

Understanding your users

So what can be seen as an improvement? How do you know if you are providing more value to a user or if you’re slapping on features your users don’t care about? The answer lies in understanding your users.

A good place to start in trying to understand your users is to use analytics tools. This seems obvious but only 21% of app developers use these. The most basic information that could provide significant value is to know the demographics of your users. Are they mostly male or female? What is the age distribution? What is their income distribution? Also, from what countries are your users and what languages do they speak? With this data it is possible to make broad categorizations of users. For example, data can show that your app is popular in France among middle aged women. Without being prejudiced, one can assume their English is not great. Translating your app can boost its popularity even more and increase overall satisfaction with your app among these group of users.

The subsequent step is to find out what interests your users have. Integrating social media login possibilities in your app and asking for the right permissions can provide you with all the self-declared interests of the user. Combining this with their demographic data gives you improved segmentation options, which is another step towards a true understanding of your users.

Contextual information is important to consider as well. Where are people using your app; at home, while commuting, at work or in the gym? When are they using it? Only at night? Several times a day? How does this correlate to other users and what conclusions can you make from this? Also, on which devices/operating systems are they using your app at home and which ones while travelling? Figuring this out can direct your creativity and efforts to build features that cater to the context in which your app is used.

Given the vast amount of apps that are offered, no matter how unique your app is, your app has competition. To understand your user isn’t limited by figuring out who they are and how they behave in relation to your app, it’s about the competition as well! How often and how much do your users log in to competitive apps? What are the unique features of the most used competitive apps? Knowing this provides valuable information of what users appreciate in competitive apps.

When all these questions are addressed there is a huge opportunity to grasp. Combine the segmentation information with the usage data from your app – sessions, time in app, ads clicked, screen flow, transactions, returning user, etc.- to identify your most valuable, most engaged and/or most loyal users. Who are they? How are they using your app? If you find answers to these questions, you’ll have identified the people who value your app the most, as well as how they use it and which features create value for them. Having this insight can mean the difference between the life or death of an app. However, it’s important to consider that ultimately the actions that are taken based on these insights decide the future of the app.

What to do next

When you know who are your most valuable (whether this means most loyal, engaged, contributing to revenue, etc.) users you can start targeting and catering to the needs of those users. For example, when implementing changes in the user interface, most developers use some form of A/B testing to figure out what the effects are. This acclaimed method of improving your product can be even more effective when you filter out the effects of those users that are of little value to you. For example, you can be A/B testing an ad in order to optimise clickrate, but seeing very small differences between the two groups. However, if you segment your audience you may see vastly different results; your target group of ‘valuable’ users might be much more engaged with the content than other user groups. The same technique can be implemented for building new features, expanding your offering of in-app purchasable items and personalizing content. [tweetable]By knowing your users you are able to make better and more timely decisions to improve your app[/tweetable]. Over time, your most valuable users are perfectly catered to which makes them love your app even more. This results in a higher retention rate, more engagement and a higher chance of getting recommended to their peers.

Financially, knowing your users makes sense as well. You can offer your ad space to advertisers that are targeting the segments you identified to be your most loyal and engaged users, which raises the eCPM and lowers idle time of your ad space. Additionally, marketing efforts to obtain new users yourself can also be highly targeted. Most developers greatly underestimate and are dissatisfied with the cost of acquiring new (valuable) users. With true user understanding it is possible to specify efforts and use your marketing budget efficiently and effectively, simply getting more bang for your buck. This is especially relevant for developers who are trying to make a decent living from their apps. These findings correspond with those of advisory company Gartner. They concluded that in order to make an app profitable, developers need to win customer’s loyalty and satisfaction by delivering a well designed and top-performing product.

Building your next app

Success is a concept that can mean different things to different people and different kinds of apps. Some developers don’t like to discuss marketing and the business side of developing and maintaining an app, but it’s an indispensable part of making an app successful. For the people that are in it to make a living, knowing your users is crucial. Raising your ads’ eCPM, lowering its idle time, getting a higher return on marketing investments and a higher Life Time Value (LTV) is worth taking the time to get to know your users. Your efforts will be focused to cater to your most valuable users which greatly improves effectiveness across all your activities, from building new features to marketing your app.

Having these insights doesn’t have to be limited to just one app. Building your next app based on this vital information can give you a head start. You can use it to answer questions such as: What platform should I focus on? iOS, Android, both or try other platforms with less competition? Optimize for smartphones, tablets or both? What sort of features were most appreciated by the most valuable users in your other app? Who were the users that did not show any improvements in usage after an update? What can you do to turn the least valuable users of your other app into the most valuable for your next one?

Having a successful app is every developer’s dream when they push their app live. However, given current statistics on overall user retention in the app stores, there is a lot of room for improvement. The old saying “to measure is to know” is very applicable in this matter, but it’s only half the work. Turning what you know into actionable information is when the real magic happens. Only then you are on the right track towards systematic improvements to your app and getting that elusive success you are dreaming of.

Categories
Business

Usage Analytics Shootout

Usage Analytics tools help developers understand their users and the way they interact with their apps. Measuring app usage in this way and using the data to help target improvements to the app can significantly improve revenues. We’ve already highlighted the duopoly in this tools sector, with Google and Flurry dominating. Our survey showed that 74% of developers made use of Google Analytics while 41% used Flurry. Clearly there’s some overlap here with developers using both and in fact less than 7.5% of developers who use this type of tool don’t use either Google or Flurry at all. However, lots of developers work on apps across multiple platforms for multiple clients and they may not always be able to use their first choice analytics tool. We asked developers to rate their primary analytics tool across a range of criteria. This data tells us which are developers’ first choice tools and how they compare.

Analytics Shootout


[box type=”alert”]The infogram service is currently experiencing some technical difficulties. We’ll bring back the interactive chart asap. In the meanwhile, you an find the filtered results mentioned in the article here.[/box]

Looking at all responses for developers primary tools Google and Flurry still dominate the market with Flurry slightly closer to Google and more than twice as popular as all of the other vendors combined. All of the tools show very high levels of developer satisfaction with Google slightly ahead overall. Outside of the top five selection criteria the only areas where other tools show significant advantages over Google or Flurry are custom views of the data and real-time analytics. If you have requirements on those areas it may be worth looking at the competition in more detail but for everyone else we can focus on the shootout between the top two.

Google beats Flurry in a head to head comparison

To try to get a more accurate comparison between Google & Flurry we filtered the data down to those developers who use both tools (and possibly others as well) such that they were in a position to make a direct comparison. This produces some interesting results; first, amongst developers that use both, Flurry is the primary tool for a majority of developers (53.1% vs 39.4%); second, on average, developers that use both tools rate Google higher on every single selection criteria, sometimes significantly so. The ratings gap between the two tools is magnified if we weight the criteria by the relative importance developers assigned in the survey. For the most important criteria, ease of integration, Flurry scores higher than Google when all responses are considered but the result is reversed when looking at only those who can make a direct comparison.

The future?

It seems Google has a slightly better tool but Flurry is still holding onto a majority of the developers that have tried both. The explanation for this slightly conflicting result appears to be that Flurry established itself as a leader in iOS analytics early and there is higher adoption of analytics amongst iOS developers in general. So, while Google’s analytics product may have the edge, it’s not sufficiently superior to justify switching for most existing users. Android ports or web apps may use Google analytics but the iOS app sticks with Flurry. This suggests that unless Flurry can improve their offering we may see their market share decline in future surveys as more developers adopt usage analytics. Given developer’s emphasis on ease of integration, the most likely disruption of the duopoly in this market would be an integrated offering – usage analytics combined with crash analytics and maybe also marketing analytics (install/referral tracking) in a single SDK.

Categories
Business

Backend-as-a-Service Economics

There are a wide variety of products that can be considered Backend-as-a-Service (BaaS) offerings. At the time of writing we list 43 of them on our sector summary page. We have previously discussed whether or not they’re a good idea and how much development effort you could save by using one. In our most recent survey we asked developers about their use of some of the most popular options. By comparing developers’ use of BaaS with their average revenues and active user bases, we can determine how well these products are working for them.

BaaS, what’s BaaS?

An interesting point to note is that a lot of developers don’t appear to know what BaaS really is yet, suggesting there’s plenty of room for growth in this sector. Almost 20% of the developers in our survey who indicated they use BaaS solutions said they were using their own proprietary backend; this is just a backend service and not BaaS, since it is built in-house rather than re-using a more generic backend solution from a third party. We exclude all of these people from this analysis. Technically it’s only really BaaS if the provider hosts it for you too, although we include options like Deployd, which is an open source project that combines with a PaaS offering like Heroku to give all the features of a BaaS (and more flexibility).

[sectors slugs=’backend-as-a-service’]

Show me the money!

Developers using BaaS solutions have an above average interest in making money. Only 11% of BaaS users were not interested in money vs. 20% of non-users. This is probably because the costs of running any kind of backend service are a deterrent to hobbyists. Of the remaining developers who are interested in making money (excluding those who were unable to report their revenues, or earned over $50k per app per month) 43% of BaaS users were earning more than $500 per app per month vs. 31% of those not using BaaS. The average monthly revenue for BaaS users was $3223 vs. $2482 for non-users. So, developers are more likely to earn enough to cover the costs of running a backend if they use a BaaS and also earn more than enough extra revenue to pay for hosting/service costs on average.

More backend features = more revenue

Not all BaaS solutions have the same feature set. The more comprehensive offerings typically have user, content and data management, along with push notifications, social integration and some kind of location data support built-in; most are also able to be extended with custom code. Less complete solutions generally only offer a small subset of this feature set, with different vendors providing different subsets. Some services are well integrated with cross-platform tools (e.g. Appcelerator Cloud Services and Sencha.io) and although they are quite comprehensive, their results appear to be more influenced by the CPT itself than the use of the BaaS – that said, users of these services also make more revenue than other users of the CPT, with Sencha coming out significantly ahead of Appcelerator in both cases. Finally, Deployd and Apigee Usergrid offer more flexible/configurable options, where users can add features from a fairly comprehensive base.


As can be seen from the graph above, users of the more comprehensive BaaS offerings make significantly more revenue than other BaaS users. On average their active user bases are only about 20% larger, so it seems the more feature rich backend services are translating to higher value generated for end users.

Which features are most important

We also asked developers which features were most important to them when selecting a BaaS. The majority of users were interested in user management and data management, features available in almost all BaaS offering and thus unsurprisingly correlated with approximately average revenues. Those primarily interested in using a BaaS for push notifications or file storage had almost half the average revenues (these are fairly easy to achieve without the overheads of a BaaS, possibly indicating a lack of sophistication) while those interested in content management made about 50% more than average and those most interested in analytics more than double the average. This outperformance for developers focussed on server side analytics mirrors that on the client side, suggesting it’s the developers’ approach and not the feature itself with produces the improved results.

Categories
Business

Why Measurement Matters – the case for analytics

Creating a successful app business takes a lot more than a good idea and the skills to develop an app and upload it to a store. As we’ve discussed before, developers who promote their apps are almost 3 times as likely to break-even as those who don’t. This is the simplest difference with a massive effect on success. It seems obvious, no marketing means a good chance almost no-one discovers the app and thus no revenue, yet some developers still don’t do it. Picking the most lucrative platforms seems like another obvious candidate; considering only those developers who are interested in making money, those that develop for iOS are a little less than twice as likely to be above the “app poverty line” (38% earn over $500 per app per month) than those developing for BlackBerry (20%). Getting your revenue model right can also make a significant difference; according to our survey, developers using a subscription model earn nearly 2.5 times as much as those using other revenue models on average. Not all apps can use a subscription model, however, there is something that almost every developer can do which is correlated with more than double the chance of being above the app poverty line and earning more than 2.5 times the average revenue compared to those that don’t…

Measuring user activity and crashes

You managed to build an app and get people to download it but how many of them still use it? When do they use it and how often? What devices do they have and which firmware versions? What features do they use the most? Which parts of the app should you focus on improving? Do your changes to the app make users interact with it more or less? All of these questions require measuring the user interaction with the app by recording data and analysing it. Unless your app regularly interacts with your own backend service which you can collect relevant statistics from then this would be an expensive capability to build. Fortunately there are a number of third party usage analytics services to do it for you and the two most popular, Google Analytics and Flurry, are free to use.

Similarly, no app is perfect when it is launched and it’s almost impossible to test on every device and firmware combination out there in the market. If some of your users are getting crashes that you can’t reproduce and fix quickly then you’re likely to get a lot of poor reviews, which will reduce the chances that other users download your app in the future. Unless you have tooling in place to capture details of crashes and report them to you then it’s very hard fix them. Although there are libraries that can report crashes to you directly, unless you want to analyse every single one manually, you’ll want tools that do that for you and categorise them such that the ones with common causes are grouped. Without this there’s no good way of prioritising what to fix. Again, crash analytics & bug tracking service providers can handle this for you and one of them, Crashlytics, was recently acquired by Twitter and now provides all of its features for free. Other providers also have free tiers.

This is not to suggest that the free options are the best for every app, just that there’s very little excuse for not using these tools because there are free ones. If you need convincing, take a look at this infographic, which uses our survey data for just the respondents that were interested in making money and earning less than $50k per app per month (we exclude the very small number of top earners as they can distort the stats, although in this case they would only make the argument stronger).

Correlation is not causation

It’s really important that we note a strong correlation between usage of analytics tools and increased success for developers only. Correlation is not causation. It’s clear that simply integrating these tools and doing nothing with the data is not going to make the slightest difference to anyone’s results. They are trivial to integrate but provide no direct end user benefit at all and no additional revenue stream. It could be argued that most providers only make these services available for the leading platforms and the extra success is primarily due to that. This is not the case – restricting the data set to those developers whose primary platform is Android or iOS produces an almost identical pattern of results. Another argument is that crash analytics services are typically focussed on native stack traces, which don’t often provide much diagnostic value for non-native apps. However, anyone tempted to blame a poorer non-native user experience produced by development tools that are also less likely to support these analytics tools should note that cross-platform tool users make more revenue.

One valid argument is that until you have a successful app with a fairly large and diverse user base, collecting crash data and analysing it is not the biggest problem you need to solve, those who use the services may simply be the ones already big enough to have the problem. There are two arguments against this. First, integrating crash analytics after you’ve acquired a large user base is too late; how many users will give you a second chance installing at least 2 updates to a crashy app (you can’t fix it until the update after you integrate the analytics)? Second, this doesn’t explain why those integrating both types of analytics tool have a significantly greater chance of being above the poverty line than those that only integrate one or the other. Similarly, whilst there is almost certainly an experience factor at work here it is clearly not the whole answer.

The most plausible explanation for these results is that those with a more scientific approach to their app business tend to collect as much data as they can and use it to drive decisions about their development. This produces more successful apps than intuition and guesswork. So, sign up for analytics services, integrate them with your apps and act on the data they provide. This process can’t magically turn a bad idea or unwanted app into a success but it can help make a decent app into a much better one. If you apply some of this data-based reasoning and scientific methodology to deciding what to build and how you market it too then that’s likely to further increase your chances of success.

Got an alternative explanation for this data? Let us know in the comments below.