
The COVID-19 pandemic has fundamentally changed the way people work and learn across industries, and developers are no exception to that. Although in the grand scheme of things, our data indicates that many developers have been weathering well the repercussions of an unprecedented crisis, there is much more to tell.
The findings shared in this post are based on our Developer Economics 20th edition survey, which ran from December 2020 to February 2021 and reached 19,000 developers. Previously we reviewed how developers’ needs were changing due to COVID-19. Now we’ve taken a deep dive into our latest survey data to find which developer groups and regional communities were affected the most by the pandemic and in what ways.
Before you dive into the data, our new global developer survey is live now. We have updated it with questions relevant for developers in 2021 – check it out and take part for a chance to leave your mark on the upcoming trends and win prizes.
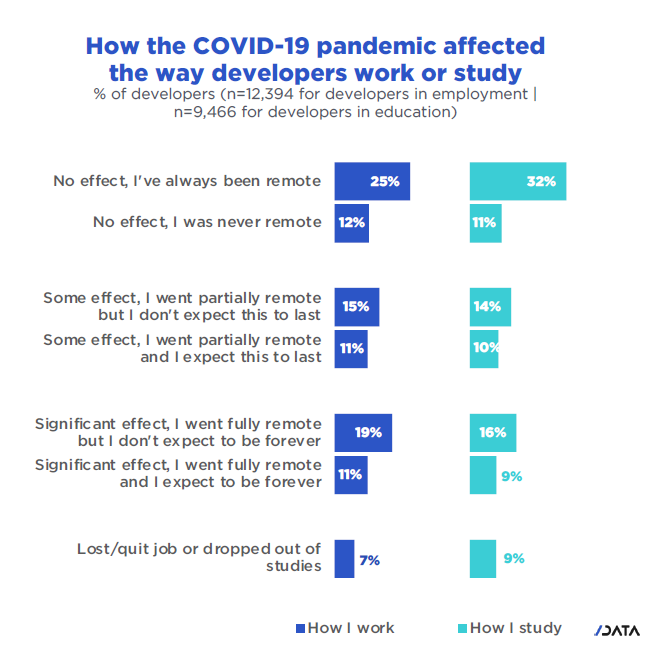
How the COVID-19 pandemic affected the way developers work or study
In our survey, we asked developers to assess the impact of the COVID-19 pandemic on the way they work or learn. In perhaps the most salient category, 7% of developers said that they had lost their job in the aftermath of the pandemic and 9% had dropped out of their studies. Notwithstanding the severity of becoming unemployed in times of crisis, the IT sector is still seen as one of the least impacted sectors in terms of hiring during the global pandemic, with an almost unwavering demand for professionals in software and hardware segments.
Which developers were impacted the most?
Arguably, not every developer has been affected by their company’s decision to enforce remote working to the same extent. For example, does a working parent who juggles the daily demands of commutes and childcare embrace the opportunity of working remotely as a means of having a better work-life balance? On the other hand, if asked, how many pre-pandemic graduates would have, at the time of their study, agreed to go fully remote and potentially miss out on exploring the rich social life that a university offers to young people? Let’s take a closer look at some of our distinct developer groups to understand which factors have been having the greatest impact on ways of working and learning.
When looking at how the pandemic affected developers of different experience levels, we find that the more experienced developers were also more affected in the way they work. For instance, 40% of developers with less than one year of work experience say they were unaffected in their ways of working, compared to 35% of developers with six or more years of experience. While the gap is not particularly large, junior developers appear to have switched to remote working to a lesser extent. This may be, in part, due to younger people and new hires wanting to go to the office, get to know their colleagues, and connect with their peers.

Next, we evaluated COVID-19’s impact with respect to company size. We find that developers working for larger companies were clearly more affected in their ways of working by the pandemic. While 42% of developers in small companies between two and 50 employees say they were not affected, the number plummets to less than 30% for developers in companies of over 50 employees. Large enterprises with more than 5,000 employees have been battling the repercussions of the pandemic at the frontlines; 51% of developers here went fully remote compared to just 29% of developers in companies with between two and 50 employees.
Developers in small companies were less affected by the pandemic.
Note that, except for small companies, switching to fully-remote working was the most likely outcome in our survey. There are good reasons for this: large business organisations are naturally more risk-averse and commonly need large contiguous office spaces that have to be fully closed for all of their employees to effectively contain the spread of the virus. On the other hand, many small companies had more remote-friendly organisational structures to begin with. In particular, start-ups have been known to promote a remote-first culture due to the apparent benefits of lower seed capital and broader options to recruit and pool talents together.
Twice as many developers in Western Europe compared to East Asia went fully remote.

Perhaps it comes as no surprise when looking at different regions to find a substantial gap between the East and the West. Our data shows that the Western regions, such as Western Europe and the Americas, have more readily facilitated remote working for their employees. For instance, 41% of Western European developers went fully remote, as opposed to only 20% in East Asia. This could be due to a combination of different factors. For example, pundits argue that many Asian countries score low for having the technological infrastructure deemed necessary to adapt to remote working conditions, such as having poor home-office equipment or internet connectivity that is sensitive to traffic surges. Yes, social factors may have partly played a role, as higher average household sizes and smaller apartments in emerging regions pose roadblocks to their own for employees to balance their work and home life.

Lastly, we looked at COVID-19’s impact on learners. 39% of 18- to 24-year olds stated that the way they study has not been affected during the pandemic. On the contrary, among those students aged 25 and over, 50% or more were not affected. Thus, an interesting trend emerges here, that especially younger learners had to adapt by becoming partly or fully remote. Our data offers one possible clue for this; younger learners are more likely enrolled in a formal degree program than older learners, who are more likely to be self-taught and are to be found burning the midnight oil with online courses and boot camps that have traditionally fostered remote ways of studying.


