Categories
Business

Engagement drives In-App Purchases for games, says Apsalar

Today’s most successful developers are giving their apps away in the app store for free, and, if done correctly, it’s an effective monetization model. At the end of October, of the top 15 grossing apps in the Apple app store, 14 of them are completely free.

This model can be both lucrative (when done correctly) and nerve-wracking, since companies are spending time and resources developing and marketing a product that they subsequently give away for free.

Fortunately for developers thinking about making a game, Apsalar’s Big Data Lab has gathered insights on some 400M unique active devices to help developers make better decisions and figure out what genres of game app developers should be making more of in order to maximize revenue.

For this report, we examined data on millions of in-app purchases. Our goal is to try and inform developers with knowledge on which game categories are most effective at driving in-app purchases and how engagement correlates to purchase events.

Strategy, Trivia & Adventure most effective at driving IAP

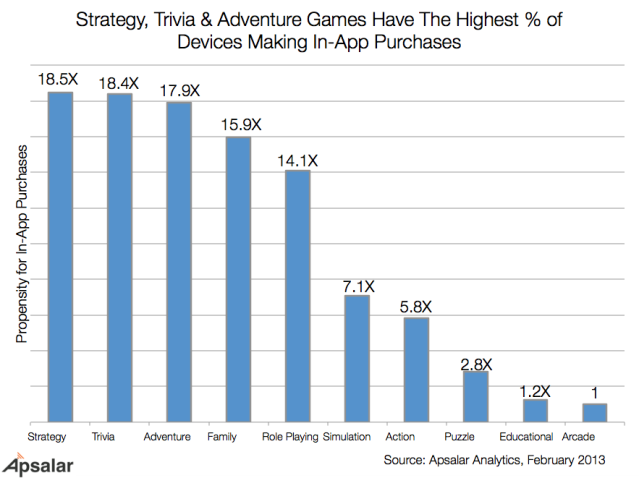
IAP_1

Our data shows Strategy, Trivia, Adventure, Family, and Role Playing games have the highest propensity for in-app purchases. Also noteworthy is the significant drop-off between the top 5 and the bottom 5 categories, as the “Simulation” category has generated about half as many in-app purchases as the “role-playing games” category. One more interesting data point on the above is how low “Action” games rank in terms of in-app purchases. The shift from predominantly casual games on mobile to more hardcore games (i.e., Infinity Blade, Rage of Bahamut, etc.) has driven some companies, who previously pioneered casual games to consider building a hardcore, action game. This data suggests that companies looking to expand beyond casual games should actually consider strategic, role-playing games as viable alternatives.

The next piece of data we looked into was average daily session length by app category. This data shows us how long users have been spending on average per day inside these games.

IAP_2

The sweet spot in terms of engagement is around 2 minutes. Interestingly, while arcade games have an extremely high average daily session length (as seen in the previous graph), they generate a relatively low number of in-app purchases.  One possibility may be that these games actually monetize best not by the freemium model, but by a business model known as paymium. In the paymium model, developers have users download free versions of their games then generate revenue by upgrading their users to, for instance, a $.99 or $2.99 paid product.

Strong correlation between IAP and engagement

The graph below presents a consistent picture between engagement and monetization, except for 2 game categories:

  • Arcade- High engagement with low monetization
  • Trivia- Relatively low engagement with very high monetization

IAP_4

The graph shows almost a straight correlation for all the data points, except for Arcade and Trivia, noted above. Trivia doesn’t appear to be an outlier though. That category generates a healthy level of in-app purchases but is still in a high engagement quadrant. The outlier is Arcade. This category has similar engagement to Trivia, Role-playing and Family (three categories that are high in in-app purchases), yet is at the bottom of in-app purchases.

A key observation is that there is no game category falling in the top left quadrant (i.e. low engagement + high in-app purchases). Which means that game developers have no chance of generating in-app purchases without high engagement.

So the key takeaway for developers using the freemium model is that it’s still critical to first focus on building a great, engaging game in one of the categories where in-app purchases are highest. Once developers have managed to do that and have engaged users, offering in-app purchases such as special items and unique gifts is a great way to take a free app and turn it into meaningful revenue.

This post first appeared on the Apsalar blog.

Categories
Business Community Tips

Test Early, Test Often, Test on Everything?

Testing any mobile app presents a wide range of challenges. The often repeated but rarely followed software best practice of test early, test often is harder to adhere to than usual due to the fragmentation of the target environment and the relative maturity of tools. The increased acceptance of apps by mainstream consumers and intense competition have raised the bars for user experience and quality. There is more to test than ever, yet often very limited budget for doing so. Fortunately every challenge presents an opportunity and a vast array of tools vendors are racing to fill the gaps.

What to test?

Much of the traditional software testing literature focuses on various forms of functional testing – ensuring the system does what it’s meant to do. With a strong trend towards simpler, single purpose apps, this is often the easiest thing to verify in a mobile app project. There is now a much stronger focus on the user experience and this requires testing of an entirely different nature. The most effective way to test that an app is easy (or even fun) to use is to get feedback from real users. Doing that and finding major issues after the app has been built is a very expensive mistake to make, so most developers and designers will want to create mock-ups or prototypes for early feedback. There’s a wide range of tools to help with this task from simple wireframing through to full interactive prototyping. Given the importance of animations within mobile apps to enable users to discover interface interactions and learn to navigate, more complete prototypes are becoming increasingly desirable. As users become more sophisticated and specialist tools reduce the time and effort required to create interactive prototypes this trend is likely to continue.

With the majority of app store revenues coming through in-app purchases, another more specialized form of testing the design of an app is becoming increasingly important – split testing. On the desktop web, tools for trying out design and copy variants to optimize sites for specific user behaviours are very mature and the best of them can be used by staff with no development skills. In the mobile world most of the tools in this space are still very immature and developer-focussed. The responsive design trend on the web and the more restricted deployment options for native apps make this a more challenging problem for mobile devices but we expect the tools in this sector to mature rapidly.

[sectors slugs=’prototyping-mockup’]

When to test?

The earlier you find problems with software, the cheaper it is to fix them. As such, it makes sense to start testing as early as possible. How about testing the idea for the app via a mobile market research service before you even create your first wireframes? It’s worth considering – if you can’t generate interest in your app idea with a simple pitch it’s not going to be easy to get people to download it from the store either.

For most apps (particularly native apps) it’ll be worth using one of the mock-up or prototyping tools mentioned above and test the design before you start coding the real app. It’s much cheaper to iterate a simple design prototype than a native app. However, you’ll still want to try out the actual app with real users before you launch it. To help with that there’s a range of beta testing services that can help you distribute your beta app and find and/or manage testers. There are also services to help you get feedback from your users before and after the app launches. Providing a highly accessible feedback channel for users in the app is your best hope for preventing the inevitable disgruntled few from leaving bad reviews.

Ideally an app will be developed and tested iteratively with functional testing of new features and full regression tests for the existing functionality run for each iteration. This level of testing can get extremely expensive and time consuming unless it is automated. Fortunately there are several tools, open source frameworks and third party services that can help out there too.

[sectors slugs=’beta-testing,feedback-helpdesk,automated-app-testing’]

Where to test?

Another major problem for mobile developers is the scale and fragmentation of the market they’re trying to serve. Collecting a full library of test devices with major firmware variants is way beyond the budget of most developers, let alone the effort that would be required to test manually on all of them. Automated testing solutions can help here also and some services provide access to a large set of devices for remote testing too. However, it’s simply not feasible for most developers to test every version of their apps on all the device and firmware combinations they support. This limitation means some bugs are almost guaranteed to escape into the wild; the important thing then becomes how quickly you discover and fix them. For this reason, crash analytics and bug tracking tools are becoming increasingly important. Another useful weapon in this battle is your usage analytics data – it can enable you to focus testing on the devices which are most popular amongst your user base and also spot changes in use on particular device models that might signal a non-fatal error that’s causing users to abandon the app.

Finally, for some apps, where they are tested geographically may also be important. Do you know what the performance of your app is like for users who are far from your servers? If you use SMS, do you know how long it takes to get to users on different networks around the world (or if it even gets there). Have the localisations for your app been tested by native speakers? Our automated testing and app certification sectors include companies that can crowdsource beta testers or provide access software testing professionals almost anywhere in the world to help you scale globally without leaving your desk.

[sectors slugs=’crash-analytics-bug-tracking,user-analytics,automated-app-testing,app-certification’]

Categories
Business

Prototyping: needless effort or driver of perfection?

Mobile apps are becoming more and more sophisticated every day. They evolve together with mobile devices, giving us even more pleasant, intriguing and unique experiences. Design, usability, functionality accompanied by various touch interactions, animations, and transitions are integral components of apps.

Building an app is not easy. It involves various stages in a long development life cycle. Apps require time to build, time to test, and time to iterate for improvements. Iterations are not easy especially when extensive code changes are required and that’s where usually things get messy.

There is one solution to avoid the trap that lies ahead when developing apps: prototyping. A prototype is an early sample or model built to test a concept or process, or to act as an object to be replicated or learned from. The prototyping step is often skipped due to the extra cost and effort it adds to the lifecycle of a project. However, it is widely accepted in the development world today, that undermining this vital part of the design and build process may lead to miscommunication between developers and clients, pitfalls, over budgeting, and bad quality products. Prototyping allows developers to conduct proper user trials, iterate before coding and send the app to production only when it is perfected.

Graphic designers, user experience designers, usability experts, interaction designers, and developers use different ways and tools to create prototypes. The most popular methods used for prototyping apps are paper prototyping, presentation software, mobile apps (usually for tablets) designed to allow people to prototype mobile applications on actual mobile devices, source code and prototyping applications and tools either web (offered as SaaS) or desktop apps.

In the following section I will briefly describe the prototype tools vendor landscape and the main needs that these tools serve.

Vendor landscape

If we ignore for a moment the paper prototyping and source code, where no specific tool is used, then we are down to three main types of prototyping tools: presentation software, mobile apps and mobile prototyping applications.

prototyping-tools-landscape

Presentation software like Keynote or Powerpoint, are in the market for decades and peeple are well trained to use them in different ways. The way people use them for prototyping, is by linking sketches, or design comps together in a presentation since such tools support animations and screen transitions. Some UI libraries like Keynotopia have UI components of popular mobile operating systems like iOS and Android, designed for presentation software. Presentation software are built for an entire different purpose and they are limited in prototyping functionality but are still valid in some user cases. Diagramming software like Omingraffle and Gliffy are sometimes also used for prototyping.

Mobile apps for iPad and Android tablets designed for mobile prototyping allow real device testing which is their main advantage. Some of these apps provide UI libraries of major mobile UI components like App Cooker and Interface HD. Others, like Popapp allow taking photos of sketches and linking them together. Most of these apps are limited to single device prototyping and usually lack sharing and collaboration tools but are very useful when it comes to quickly validating an idea.

Mobile prototyping applications are web or desktop applications designed specifically for mobile prototyping. These applications vary from simple traditional wireframe applications (including mockups) to advanced prototyping tools that are able to provide a varying degree of mobile-specific functionality such as touch events and gestures, interactions, screen transitions. Most importantly these tools provide the ability to preview a prototype on the actual device.

There are three different types of such mobile prototyping applications:

  1. Hotspot apps are usually web apps that allow you to upload your mobile design comps and link them together usually with a single event (click or touch) without (or at best simple) transition effects. These apps are useful especially for collaboration as most of them allow comments and annotations. Although some of these tools make real device preview possible (i.e. preview on the actual device that the app is built for), they are not really eligible for proper user trials as they do not allow multiple interactions such as touch gestures and other important mobile specific features. Applications in this category are Fieldtest app, Invisionapp, Popap and are usually web apps offered as Software As A Service or mobile apps for tablets and Smartphones.
  2. Wireframe or Mockup tools are tools that allow the development of still wireframes or mockups. Usually these tools have a large number of UI components libraries available. Some of these tools have been in the market for years as they were designed for website mockups or wireframes, but many of them have been changed in an attempt to embrace needs specific to mobile apps. Many of these tools are very advanced in functionality and features, offering a range of useful companion tools for collaboration and more. Most of these tools are limited to single tap interaction (or mouse interactions, as they are designed for web sites) and no or limited animations and transitions. Tools that fall under this category include Balsamiq, MockingBird, UXpin, Pidoco and others and they can be found as web apps available on a subscription basis or as desktop apps.
  3. Prototyping tools are web applications or desktop software designed from the ground up and specifically for mobile (or web) prototyping. These applications go beyond traditional wireframe or mockup applications, to provide functionality for mobile touch events and gestures, interactions, screen transitions and most importantly provide the ability to preview a prototype on the actual device. Many of them come with UI libraries for iOS, Android, Windows mobile and Blackberry and offer collaboration tools and functionality. Tools and software in this category include Axure, Indigo Studio, Proto.io and many more.

[sectors slugs=’prototyping-mockup’]

Current challenges with prototyping tools

Prototyping tools are still in their infancy. They have been around for two years or less must be in sync with the ever changing mobile industry. New mobile devices become available on a daily basis, new versions of mobile operating systems and new functionality that needs to be supported makes the chase even more difficult. The main challenge is the ability to test the prototypes on the real device. In order to achieve this more tools render their prototypes in HTML5 so that they can run on a native mobile browser without the need of installing and maintaining various mobile apps.

Another major challenge is performance and by using HTML5 features such as animations render much slower on a mobile browser than they would on a native app, making the experience a bit far from real and as such defeating the purpose of doing a full prototype in the first place. Nevertheless, some of these tools have reached a maturity level that allow professionals to create fully functional, interactive mobile app prototypes of their apps that look and behave exactly as their app would. This allows the teams to conduct user trials, gather feedback, and iterate for improvements. Furthermore, a proper prototype narrows the communication gap between designers and developers (coders) as well as with the app team and the stakeholders.

Future opportunities with prototyping tools

Prototyping tools gain larger audiences as mobile technologies progress. As mobile apps become more sophisticated, more detailed prototyping is required. The mobile market grows and the prototyping tools market will continue to grow with it as more Operating Systems and newer more capable devices are released. New devices come to life every day, from car navigation systems to refrigerator panels, all having in common touch and interactive interfaces.

Categories
Tools

Voice on the verge of break-through? Going beyond telephony with Voice Application Platforms

Voice communication is one of the core functionalities of every mobile phone. However, telephony is up for a big shake-up, as Internet telephony companies like Skype and voice application platforms like the ones below are challenging century-old assumptions about how people speak with each other remotely. (You can read all about this trend on the VisionMobile blog: here and here.)

Indeed, voice is no longer the domain of telecom operators alone. Voice Application Platforms allow you to make creative solutions that integrate voice communication deeply in your app: as voice messaging, click-to-call, person-to-multiperson, voice search and more.

Voice platforms cater to many use cases

Voice APIs allow developers to integrate voice functionality within their apps, bypassing the telco services that traditionally provided these capabilities. Developers use Voice services to enable a number of use cases such as voice calls, conference calls, video calls, voice transcription, IVR services etc. Telcos such as AT&T and Verizon are reacting to this trend (for over-the-top services) by opening up access to their services via APIs.

While Voice services cater to a number of different use cases, their use is relatively low among developers because, contrary to other tools in the Developer Economics 2013 survey, they are specialised tools that provide functionality within an app rather than support for the app or the business (as, for example, user analytics or ad services).

The different services surveyed cater to a different mix of use cases, and therefore do not always compete against each other. Developers integrating voice services in their apps tend to use them primarily for enabling voice call capabilities within their apps, including Conference calls (33% of developers utilising Voice services), Outbound calls (29%), and Inbound calls (24%). About a quarter of developers using voice services, are interested in Speech recognition while 20% use them to implement IVR applications. Callback function is also quite popular as indicated by 20% of developers utilising using voice services.

DE13-17-01

Skype (39%) is leading, with Twilio (31%) following

Skype leads in developer mindshare when it comes to voice services, used by 39% of developers that integrate Voice services within their apps. However, Skype does not provide services through an API but rather through URIs that redirect the user to the Skype client which must be installed on the user’s device. Developers using Skype use it primarily for conference calling (55% of developers utilising Skype), Video calls (43%) and Outbound calls (37%).

Twilio follows at a short distance, utilised by 31% of developers implementing Voice services. Twilio API allows developers direct access to voice services within their apps. Twilio users mostly use the service for Outbound and Inbound calls (43% and 41% of developers using Twilio respectively).

Microsoft Voice services, used by 27% of developers using Voice services, use it mainly for Speech recognition (44% of Microsoft voice services users) and Speech transcription (30%). Telco APIs such as those provided by AT&T and Verizon are less popular (17% and 10% of developers using Voice services), while OneAPI, a joint attempt by telcos to react to the OTT threat, seems to fall far behind at 4%. The AT&T API is mainly used for Conference calls and Callback (36% and 32% respectively). The latest AT&T Call management API, powered by Voxeo Labs Tropo Platform, allows users to link their cellphone number to OTT Voice services provided via AT&Ts API, negating the need for a new phone number. Tropo, by Voxeo Labs is used by 5% of developers using Voice services and is mainly used for Conference calls (50% of developers using Tropo), Speech recognition (41%) and IVR applications.

Quality is still key selection criterion

Most developers (39% of those using voice services) highlighted performance and quality as a top selection criterion for Voice services. Voice quality is not guaranteed on mobile data networks but is critical in most use cases where voice services are used, particularly in real-time voice such as conference calling. While network quality is often out of the direct control of voice services providers, there is still a lot that can be done on the service providers’ side such as optimising encoding algorithms and scaling the architecture of their voice infrastructure. Ease of integration and availability across platforms, the prevailing selection criteria among all third-party tools and services are also important when selecting a Voice services, as highlighted by 35% and 34% of developers using Voice services, followed by cost (27%).

[doritos_report location=’DE13 Article – Voice platforms’]

Which voice services are other developers using?


[toggle title=”Important things to know about this interactive graph”]

  • All the filters in the graph refer to survey questions in which respondents could select multiple answers. This means that there is no direct link between the filter and the use of the tool. For example, filtering on “Android” means that the respondents develop Android apps. It doesn’t imply that they use the tools for their Android apps specifically, or even that the tool supports the Android platform. Use filters as a guideline only.
  • Keep an eye on the sample size. If the sample size is low, the graph doesn’t offer strong conclusions about the popularity of different tools. Use your good judgment when making decisions.[/toggle]

    Find the best voice provider for you!

    [sectors slugs=’voice-platforms’]

Categories
Business Tips

How to Optimise Ad Revenue

On the surface, advertising seems like a fairly simple and easy to implement business model for an app. Decide on some places to display ads, integrate one or more third party ad services and wait for the money to start rolling in. If you do this without a clear plan for how and why users will interact with ads in your app you’ll probably find the revenue disappointing. Optimise revenue by growing your user base, increasing engagement and improving your fill rate (how many of your possible ad slots actually show an ad) and eCPM (effective cost per thousand impressions). The challenge becomes apparent when you try to improve these metrics and find them somewhat opposed to one another. Show too many ads and users either use your app less or abandon it altogether. Make the ads smaller or display them less prominently and your click-through ratio (and hence eCPM) goes down. Show a lot of irrelevant ads (higher fill rate typically has less relevance on average) prominently and users start ignoring all of them by default. Make your ads prominent and they’d better be relevant. If it’s hard to target your audience well then keep the advertising low key and count on volume to make up the revenue. It turns out that getting the right balance is very difficult and not many developers manage it.

Higher eCPM != higher revenue

A very small fraction of developers in our survey managed to achieve truly exceptional eCPM’s, greater than $5, sometimes even more than $10. These developers were almost all making multiples of the average revenue in total but they were also using more than one revenue model. It’s likely that most of their revenue was coming from another source and they showed very few highly relevant ads to get those rates. If we focus on the developers who only used advertising as a revenue model then those with eCPM’s below $0.25 were earning significantly more on average than those with eCPM’s from $0.25-1.50. So, for the majority of developers, those with higher eCPM’s make less money. To add to the confusion, size of active user base is also very weakly correlated with ad revenue; the simple concept of getting more users to make more money from ads doesn’t work on its own either.

Why iOS developers make more with ads

A good illustration of the complexity is to compare iOS and Android developers. As reported by several ad networks, iOS gets a higher eCPM on average than Android. However, our survey data suggests that the difference is all at the very high end. If we exclude the developers with eCPMs over $5, iOS actually has a lower eCPM than Android. For those only monetizing via ads, Android developers had a 37% higher eCPM and while the iOS developers only had 20% larger user bases on average, they earned almost 75% more revenue every month. This suggests that the iOS developers were seeing very much higher engagement with their apps and thus delivering many more ad impressions.

The fallback network fallacy?

There’s some popular advice that in order to maximise ad revenue, developers should use at least two ad networks, one with a high eCPM and low fill rate and another with a lower eCPM but very high fill rate. The theory is that this ensures they get the most relevant targeted ads with the best rates when they’re available but still don’t waste the inventory by filling it with less relevant lower paying ads when they don’t get filled by the premium network. This fallback strategy sounds logical but does it work? There’s some possible support for this in the fact that developers using more than one ad network make slightly more money on average than those who only use one (and 70% of developers purely monetizing through ads only use one network). However, this seems more likely to indicate greater sophistication than successful use of the fallback strategy. The ads from the two different networks are unlikely to fit the same presentation, positioning and format within an app well. There’s some fairly strong evidence against this fallback strategy within our survey data – developers with eCPMs above $5 are excluded from the following sample and so are those earning greater than $50k per app per month in revenue due to the disproportionate effect both tiny minorities have on averages.

Note that 67% of developers using ads selected neither eCPM nor fill rate as reasons for choosing their ad networks and that percentage is mirrored in the group only using ads for monetization. Those that selected one criteria or the other but not both generated slightly higher eCPM than average and significantly higher revenues. Developers trying to maximize both metrics to squeeze the maximum possible revenue out of the advertising space in their apps generated the highest eCPM but did far worse than average on revenues.

Optimise for engagement

This data suggests that developers should pick an appropriate advertising style for their app and try to go for either quality or volume of ads displayed but not both. Considering that the most popular advertising services use a cost-per-click model, the highest eCPMs are likely to simply reflect higher click-through ratios. In many cases the taps on ads may be accidental. Ads getting in the way of the content or usage of an app result in fewer users or lower usage and thus lower revenue. It seems that by far the best way to optimise ad revenue is to build app experiences that people want to spend a lot of time using and make sure the ads don’t spoil them. The extra volume of impressions generated by tens or hundreds of thousands of engaged users will more than make up for lower eCPMs or ad inventory not getting filled.

Categories
News and Resources

The user analytics duopoly: Google and Flurry are well ahead of competition

Usage analytics tools usually have a very simple integration which enables developer to get basic information about their active user base – size, usage frequency, device models, OS versions and app versions in use. More custom integration enables developers to log events to the usage analytics platforms when users perform specific actions within the app. This allows developers to track which features or functions are most use, measure conversion rates and pinpoint where in UI flows users are giving up if actions are not being completed.

User analytics services gain in importance as competition intensifies

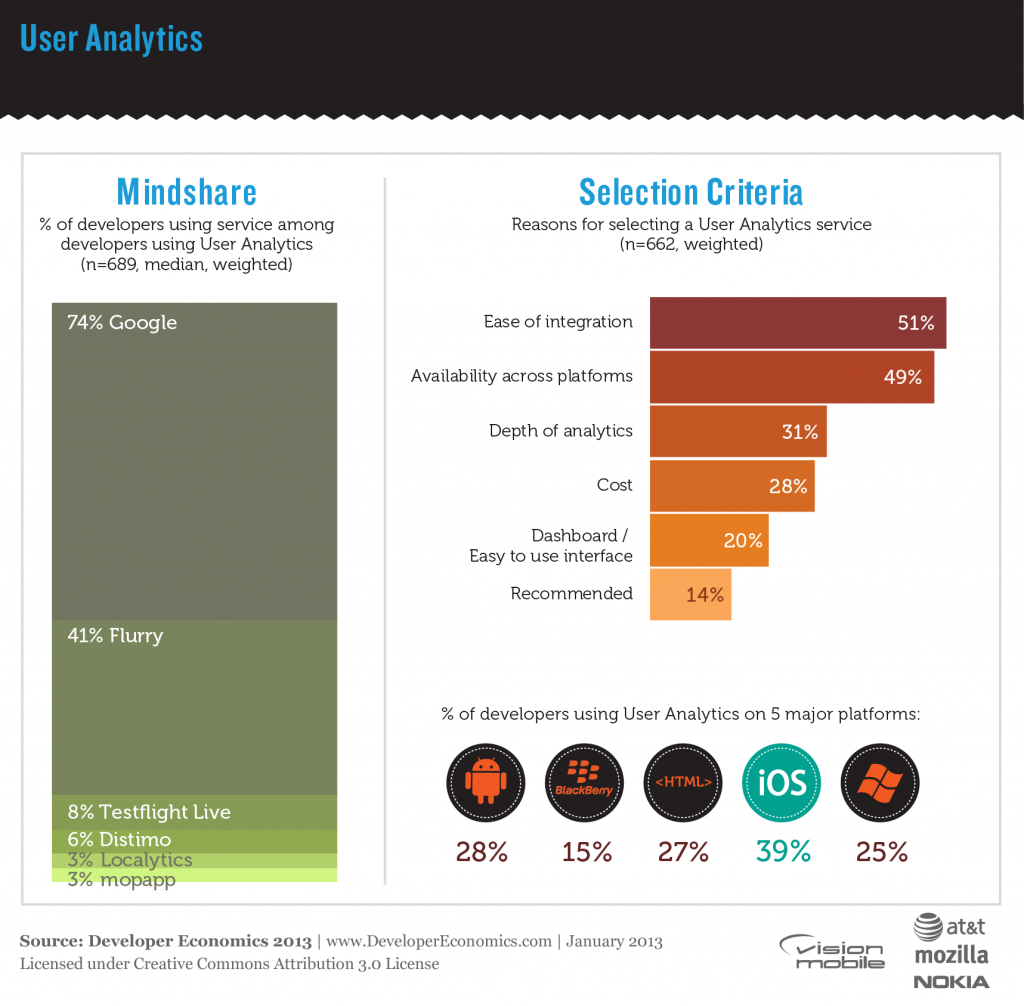
User analytics services are becoming increasingly important as competition in app development continues to rise. The ability to track how users interact with apps is extremely valuable for both developers and product managers and to some extent acts as a proxy for user feedback. The absence of a direct two-way communication channel between developers and users means that user analytics often provide the only channel from user to developer. 28% of developers use user analytics services overall, but usage rises with the number of apps developed, reaching 39% among developers working on more than 10 apps per year.

Analytics services seem to be significantly more important among iOS developers (used by 39% of iOS developers) compared to other platforms. This suggests that iOS developers take more interest overall in their user base, a fact that could indicate a more professional approach to development. Among the top platforms, user analytics tools are the least popular with BlackBerry developers (15%). BlackBerry has suffered high churn of its affluent user base and developers sticking with the platform are likely to be working on outsourced ports with little interest about the way that users interact with an app. Among the other major platforms around a quarter of developers use user analytics, with Android being slightly ahead (28% of Android developers).

DE13-19-01

Google and Flurry lead the pack

The picture in user analytics services is quite telling with two services dominating: Google and Flurry. Google has traditionally been strong in web analytics but it has now extended its stronghold on to mobile platforms commanding a 69% mindshare among developers employing User Analytics services. However, its dominance is mainly observed among HTML developers and although it leads on Android, BlackBerry and Windows Phone, its lead is by a small margin. Runner-up Flurry, is used by 49% of developers employing User Analytics services but is the leading User Analytics service on iOS (64% vs. 58% for Google). Flurry, being one of the pioneers in User Analytics has grown into one of the heavyweights in app ecosystems, and is recognised as a de-facto analytics platform for developers. Beyond these two services, there are numerous smaller players vying for third place, currently held by Testflight Live, a service recently acquired by ad mediation service Burstly in a move that is quite typical of the synergies between different tools and services that drive consolidation in the marketplace.

User Analytics services are stronger in Media apps (News/sports/weather/magazines) as well as in Entertainment apps, used by 36% of developers working on such apps. However, they are more or less popular across all app categories, but less so in Education/Reference apps. Google analytics is stronger overall across all these categories, with the exception of Games where both Google and Flurry are equally strong.

Minimizing overhead is the priority

Developers opt for services that are easy to integrate within their apps or that are available across several platforms as indicated by 51% and 49% of developers using user analytics services. I.e. the main priority for developers is to minimise the overheads associated with using user analytics, while optimising analytics comes third: only 31% of developers using user analytics services are concerned with the depth of analytics, and only 13% are interested in real-time reports. Cost is a also deciding factor as pointed out by 28% of developers employing user analytics.

We asked developers using User Analytics services to indicate the number of active users of their most popular app. Excluding those apps that have more than 500,000 users, developers’ most popular apps have an average active user base of 56,000 users, although this number varies widely within platforms and across platforms. iOS developers indicated 70,000 users vs. 51,000 users on average for Android. The median user base, is 27,500 users for iOS and 15,500 for Android, indicating that while Android commands a higher market share, iOS users engage more actively with the platform when it comes to apps with less than 500,000 active users.

[doritos_report location=’DE13 Article – User analytics’]

Which user analytics tools are other developers using?


[toggle title=”Important things to know about this interactive graph”]

  • All the filters in the graph refer to survey questions in which respondents could select multiple answers. This means that there is no direct link between the filter and the use of the tool. For example, filtering on “Android” means that the respondents develop Android apps. It doesn’t imply that they use the tools for their Android apps specifically, or even that the tool supports the Android platform. Use filters as a guideline only.
  • Keep an eye on the sample size. If the sample size is low, the graph doesn’t offer strong conclusions about the popularity of different tools. Use your good judgment when making decisions.[/toggle]

    Find the best analytics tool for you!

    [sectors ids=’40’]

Categories
Business

The Six Biggest Challenges for App Businesses (and what to do about them)

In our Developer Economics 2012 survey, we asked developers about their biggest challenges. Here we discuss six of them, with some basic tips on what to do about them. The challenges are split between marketing and post-launch app and user management. The three biggest marketing challenges were: keeping users engaged, targeting the right users and identifying the right revenue model. The three biggest post-launch challenges were: Tracking bugs and errors, getting users to review your app and updating applications in the field.

Keeping users engaged

Keeping users engaged was the challenge cited most often overall, by 39% of developers, irrespective of primary platform. This is consistent with data from analytics firm Flurry, who report that user engagement falls sharply over time, with only 24% of consumers continuing to use an app after three months from download. “Developers must focus on tracking user engagement & usage patterns rather than just on downloads” notes Jai Jaisimha, founder of Open Mobile Solutions, a brand-to-developer matchmaking service.

There are many techniques for improving user engagement and retention. Social buttons like Follow or Like, especially when integrated with social networks are known to increase engagement. “‘Follow is the most common social feature used by our users” notes Yiannis Varelas, co-founder of Weendy, a weather app for surfers, with 6,500 monthly active users and 80% retention rate (in May last year). Where direct social integration doesn’t make sense, push notifications are another tool to help keep users engaged.

Gamification is another retention technique that rewards users for achievements (e.g. FourSquare-style badges) or for inviting other users (e.g. for each user you invite to Dropbox, you get another 250MB free storage space). Moreover, Tom Hume, founder of Future Platforms, argues that developers need to fundamentally rethink user retention. “To improve retention, developers need to build up value for the user that increases with usage. A natural way to do this is to build in a history of usage data – for example in the Nike Plus the value and stickiness of the application increases as more data is recorded in the application”.

Targeting the right users

The second most oft-cited challenge is targeting and getting through to the right users – mostly because existing app stores offer little in the way of user targeting. App stores, for example, provide no means for developers to reach existing customers or gain information about them. The only way developers can target users via app stores is via coarse-grained methods based on app categorisation or keyword selection.

Consequently, we found that developers using app stores are more concerned about targeting (39%) and engagement (46%) than developers using most other distribution channels. The situation in carrier portals is even worse: around 55% of developers using them are challenged by targeting and engagement.
Customer information, as with any business, is a key source of competitive advantage. As such, app stores have little incentive to share customer data with app developers. Apple has done so in part, after considerable pressure, but only to Newsstand publishers, and only where customers opt in. There’s more to it than just control: app store owners are loath to jeopardise user privacy contracts, lest their platforms become marketing “wild wests.”

The inaccessibility of customer information will likely remain a thorny issue, and one that hampers developers’ marketing potential. For the moment, it generates a flurry of innovation, as evidenced by the proliferation of in-app and external app marketing channels. However, seeing as this will remain a pain point, there may be opportunities for app stores to differentiate, if they manage to balance their priorities against those of developers – as Apple arguably has with Newsstand publishers. In the meantime, app developers would be wise not to wait for the app stores to fix this. Try to reach the right users for your app wherever they are currently, via blogs, forums and more traditional media. Arrange cross-promotions with similar but complementary apps. Experiment with alternate discovery solutions and find out what works for your app.

Identifying the right revenue model

Developers were becoming increasingly confused (36%) about which revenue model to use. There are over 10 revenue models to choose from and no guarantees as to which revenue model will work best in the long run in terms of reach vs. monetisation. Moreover, the revenue model needs to be optimised to the platform and app category. The decision should also take into account factors such as customer paying propensity (which varies across platforms), competitor pricing and positioning (which varies by app category). For example, paid downloads are extremely unpopular on Android, whilst apps aimed at children often need to use that model, since parents are very uncomfortable with in-app purchase or advertising based models for apps their children are using. User needs should also come into perspective when considering
your pricing strategy. “You may only need one Facebook, sports or weather app, but you will want to play many games. Mobile games are like movies – users are always looking for the latest one,” notes Markus Kassulke, CEO at Germany-based HandyGames.

Overall, we found that pay-per download was the revenue model used most frequently, by 34% of developers irrespective of platform, followed closely by advertising, which was used by 33% of developers. Wherever possible, the best advice we can give for now is to try some sort of freemium or virtual goods model using in-app purchases. The growth of in-app purchase revenues across iOS and Android is significantly outpacing paid downloads.

Tracking bugs and errors

Tracking bugs and errors was, by far, the most frequent post-launch headache, as reported by 38% of developers in our survey – and particularly so for WP7 developers. There is no direct feedback channel between users and developers, and no out-of-box
means to monitor the performance of an app. App reviews work and feel more like post-mortems, rather than a live feedback tool. As a result, developers will often find out what’s wrong with their app too late, through users’ negative feedback. “Our biggest headache after launch is the lack of a two-way communication channel with our users” notes Hong Wu, Director of Android Engineering at Peel, makers of a personalised TV guide app.

The first line of defence here is to remove as many errors as possible before launch, both through good engineering practices during development and extensive beta testing. The second line of defense comes in the form of crash analytics and bug tracking services. These services track app errors by monitoring crashes and reporting the type of error, platform, device and environmental variables like location, time and transaction flow. As such, they can provide useful insights, helping find and fix errors before they drive users away.

Updating applications in the field

Updating apps was highlighted as a challenge by 25% of developers irrespective of platform. Interestingly, the difference in the update process between iOS and Android has no impact on developers’ attitudes – as both iOS and Android have their own update challenges. On iOS the process requires full certification and approval by Apple, plus explicit opt-in by the user. On Android, the update process can be automatic and near-instantaneous. This however requires that users opt-in for automatic updates for specific applications. In effect, these challenges with the update process on both iOS and Android increase the average application “age” and escalate both code maintenance and customer support costs for developers.

One solution to this is to have the app check for the availability of a newer version at launch. Although it may not be possible to have the application download the update, it could prompt the user to do so. Another option here is to track application versions via analytics and send push notifications to users with sufficiently old versions, highlighting the benefits of updating to the latest version.

Getting users to review apps

Last but not least, another frequent post-launch challenge was getting users to review apps, reported by 30% of developers irrespective of platform. At the same time, there have been some success stories of apps boosting their review numbers, usually by nagging users after they have used the app for some time. For example, to solicit reviews, DrawSomething shows a motivating alert where “Rate 5 stars!” and “Remind me later” are the only two options, wrapped in a friendly pop-up box. The example shows that the runaway success of DrawSomething was more science than luck. However, DrawSomething’s grossing ranking was declining in the run-up to the all-important Christmas sales season, showing that even successful and well funded apps with highly social components can struggle with our first challenge – keeping users engaged in the face of all the other shiny new offerings in the app stores.
Categories
Business

Growth Lessons from LinkedIn

Elliot Schmukler from LinkedIn spoke at a recent Growth Hacker conference about the strategies they’d used to grow the site since he joined in 2008. His advice was very helpfully summarised by Sandi MacPherson, Founder at Quibb and is general enough to be applied to mobile apps. Here’s our take on his main points.

Before you get started: Understand your channels

It’s important to understand how new users come to your product. Although it may be distributed exclusively through an app store, if that’s the only way users discover your product then you’re unlikely to succeed. This aspect of app marketing is still evolving rapidly, so keep testing different channels but focus your resources on the ones that generate the best results for you.

Categories
Business

Advertising to Existing Users – could re-engagement reap rewards?

Currently the vast majority of mobile app advertising is used to generate new installs. At the same time, for some of the most successful revenue models, a small fraction of the most active users generate the bulk of the revenue. Free-to-play games are a good example of this model but there are similar in-app purchase driven schemes in other categories. Whilst a user is still very engaged with an app it’s likely that the most cost effective way to increase their spend is within the app. However, if an existing user stops using an app regularly ,then might there be more value in re-engaging users than acquiring a new user?

Categories
Platforms

From Mobile to TV: The companion screens opportunity and the role of apps

[This post on Mobile to TV, by Peggy Albright, guest author for VisionMobile, first appeared on the VisionMobile blog on  17 September 2012.]

[The latest trend in app development is targeting companion screens, as a way to bridge a multi-screen experience. Guest author Peggy Allbright investigates the future of app development on companion screens -and TV apps in particular – and discusses how TV advertising has found a whole new screen to engage users on.]

The Future of TV Apps

TV applications are opening up a new business frontier for the mobile industry. But we are still in the most nascent phases of the TV app industry’s formation and it needs to evolve on many fronts. Fortunately, early startup activities are revealing some of the roles that devices, apps, developers, merchandising and advertising can play in this industry, as we’ll see in this article.

The industry is well aware that consumers want to be engaged with their devices while watching TV and that many consumers are beginning to use mobile devices and apps as interactive “companions” to supplement the TV viewing experience. New research released by Google in August provides some of the latest data to characterize this trend. Google found that in a typical day, 77% of television viewers use a second device, such as a tablet, smartphone or PC, while watching TV. More than one-fifth (22%) of these consumers are using the TV and their second device in ways that complement each other, even if it is only a simple search related to the live TV programming.