Categories
Business Platforms Tools

State of the Developer Nation: The App Economy Consolidates Before the Next Gold Rush

Our 7th Developer Economics survey broke all records again, reaching more than 10,000 app developers from 137 different countries. The full report with the survey findings has just been published and is available for free download!

The view of the app economy that they collectively provide is one of consolidation. Developers are focusing their attention on fewer platforms and app revenues are becoming increasingly concentrated amongst the top publishers. Consolidation in the developers tools sector may also be partly responsible for the decline we see in tools usage. This is also reflected by the platforms, with BlackBerry moving their focus away from consumer smartphones and Microsoft killing their recently acquired Asha and Nokia X platforms to double down on Windows Phone. Fortunately there are several indicators that the next gold rush is just getting started.

Platform Wars in the App Economy

On a global level the platform wars are ending with iOS claiming the majority of the high-end device market and Android winning almost everywhere else. This results in [tweetable]Android leading in developer mindshare at 70% with iOS a clear second with 51% of developers targeting the platform[/tweetable]. However, we’ve been tracking this metric since 2010 and there is a new pattern. [tweetable]Windows Phone was the only platform to gain developer mindshare, rising steadily to 28%[/tweetable], despite failing to gain device market share. Although Android and iOS lost developer mindshare, this was not fewer developers prioritising either platform, rather more developers are now choosing sides. The average number of platforms a developer targets has fallen from 2.9 to 2.2 over the last 12 months, with more than 40% only targeting a single platform.

DE2014Q3_Mindshare

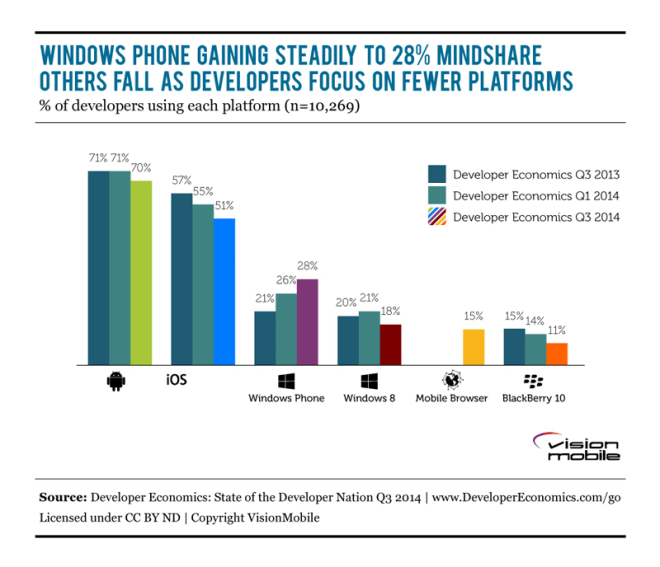
BlackBerry 10 is rapidly leaking developer mindshare, down to 11%, having failed to gain traction with consumers. Meanwhile, it’s now becoming increasingly clear that [tweetable]the future of HTML5 lies beyond the browser[/tweetable]. Although HTML5 is used by 42% of developers as a technology for app development, only 15% still target mobile browsers as a distribution platform.

A surprisingly high 47% of iOS developers and 42% of Android developers are using something other than the native language on their platforms. While hybrid apps are the most popular non-native option for building Android and iOS apps, they’re only used by 13% of developers. Hybrid apps are HTML5 apps with a native wrapper, typically created by tools such as Cordova.

DE2014Q3_NativeMyths

App Revenues

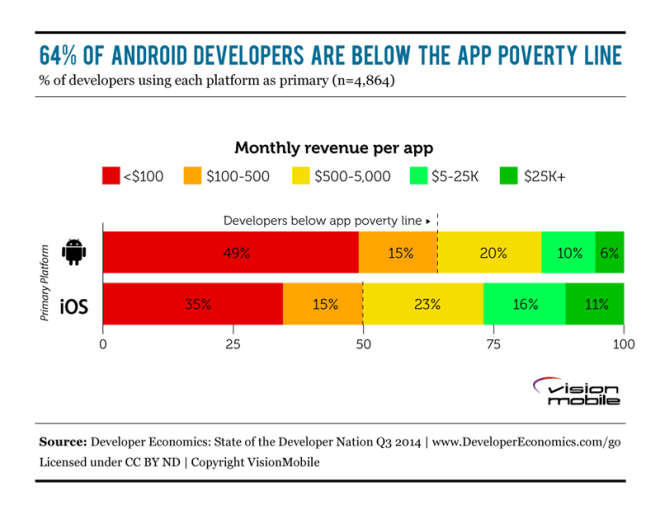
The majority of app businesses are not sustainable at current revenue levels. [tweetable]50% of iOS developers and 64% of Android developers are below the “app poverty line” of $500 per app per month[/tweetable]. 24% of developers interested in making money earn nothing at all. A further 23% make less than $100 per app per month. The overall app economy, including all revenue sources not just the app stores, is still growing but the revenues are highly concentrated. At the top end of the revenue scale there are just 1.6% of developers with apps earning more than $500k per month, collectively they earn multiples of the other 98.4% combined.

DE2014Q3_iOS_vs_Android_Revenues

State of the Game Developer Nation

Games dominate app store revenues, yet most games developers struggle. [tweetable]33% of developers make games but 57% of those games make less than $500 per month[/tweetable]. Experience breeds success in the games market. The more games a developer has shipped the more likely they are to be financially successful. However, 70% of games developers have shipped less than 4 titles.

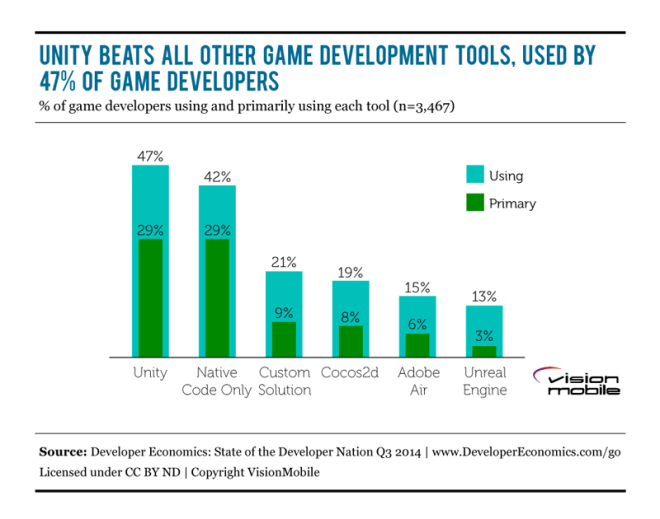
Games is a multi-platform world with the average games developer targeting 3 platforms versus 1.75 platforms for non-games developers. Multi-platform games benefit from cross-platform game development tools with Unity by far the most popular, used by 47% of developers. The next paid tool, Adobe Air, comes a distant second at 15%. Apple and Google’s latest graphics technologies launch a battle for the richest gaming experiences. Third party game development tools like Unity and the Unreal Engine will be key to developers exploiting these capabilities.

DE2014Q3_Game_Dev_Tools

Tools of the App Developer Trade

Third-party tools are a critical part of successful app businesses. There’s a strong correlation between tool use and revenues, the more tools a developer uses, the more money they make. We successfully predicted the rise of the Mega-SDK, where consolidation amongst tools companies allows developers to integrate multiple tool categories from a single vendor. Despite this, tool use is declining, partly due to the rapid influx of new mobile developers. These new developers are typically not aware of the tools that are available and thus reduce the average usage levels. 26% of developers that are interested in making money don’t use any third party tools, up from 14% just 12 months ago.

DE2014Q3_Tool_Popularity

The most popular category of tool is Ad Networks, with 30% of developers using them. However, this is one of the few tool categories that is not associated with higher than average revenues. More experienced and successful developers show a preference for Cloud Computing platforms, such as Amazon Web Services or Microsoft Azure, with 40% of those with 6+ years experience in mobile apps adopting them.

Enterprise Apps – The Next Gold Rush

[tweetable]Enterprise apps are already the safest bet in the app economy and they’re only just getting started[/tweetable]. 67% of mobile app developers primarily target consumers and 11% target professionals directly. The 16% of developers who target enterprises are twice as likely to be earning over $5k per app per month and almost 3 times as likely to earn more than $25k per app per month.

DE2014Q3_Enterprise_vs_Consumer

Penetration of enterprises with mobile devices and solutions is already broad but not yet deep. Currently iOS appears to be winning the battle for enterprise adoption and revenues. Yet many developers are focusing on the wrong platform with 10% more enterprise developers targeting Android than iOS. Although enterprise apps have been a historical strength for them, Microsoft and BlackBerry are seeing very weak adoption for their new platforms amongst enterprise developers due to lack of demand from enterprises.

This battle is in the very early stages. Microsoft is re-focussing on their core competence in productivity software while Apple and Google move rapidly to embrace enterprises. Google’s integration of Samsung’s Knox platform into the Android platform is a major step forward. Meanwhile Apple’s new partnership with IBM gives them a strong proposition in all the major vertical markets. These moves will undoubtedly drive greater adoption of mobile technology in enterprises and create countless opportunities for developers to help re-think the way we work.

For more information, download the full Developer Economics Q3 2014: State of the Developer Nation report and check out the war between the European and the Asian app economy.


Categories
Business

Top revenue models by screen

Screens are everywhere. We’re rapidly being surrounded by bits of glass with some app or other running behind them. Developers have an ever increasing choice of screens to target. There’s a clear and increasing trend towards greater use of mobile screens. However, where is the money? Which screens are users most likely to pay for apps and content for? Are different revenue models better suited to particular screen types?

Revenue_Models_FINAL

Mainstream screens

Our developer surveys are only for developers who target mobile devices. However, the developers don’t exclusively target such devices and some don’t even consider them their primary target. The only screen types considered a primary target for large numbers of developers are smartphones, tablets and PCs; all other screen types are relatively small niches. There is some interesting variation in the success of different revenue models by screen type. However, developers earning very high revenues (>$100k per app per month) are fairly evenly spread across revenue models and so they significantly distort averages towards less popular revenue models. It turns out that nearly all of these developers actually use several revenue models simultaneously (far more than the average developer) and we don’t have the data to split out which ones are actually bringing in the bulk of the revenue. Excluding these high earners from our analysis we see the spread of revenues across screens and models in the chart below.

Where’s the revenue?

The most obvious pattern is that [tweetable]revenues for developers who primarily target PCs are generally higher than for those who target smartphones[/tweetable], which in turn are higher than those for tablets. Now, remembering that these PC developers also target mobile platforms, we are most likely looking at more mature businesses and almost certainly more developers targeting enterprises. Affiliate or CPI (cost per install) scheme revenue stands out for PC developers in particular. Affiliate marketing is a fairly big and mature business on the desktop web but CPI schemes for mobile app developers are a relative new and high growth business. Currently, anyone who can reach mobile app users and provide paid installs below the expected lifetime value of an average user is seeing significant demand. With development costs essentially fixed and the marginal cost of serving a new user extremely close to zero, successful consumer focussed mobile apps are willing to pay handsomely for installs.

The notable exceptions amongst tablet first developers are those selling subscriptions; [tweetable]median revenues for tablet subscription apps are by far the highest across all screens and revenue models[/tweetable]. It’s easy to speculate, with tablets being such excellent media consumption devices, that these subscriptions are mostly for media content (magazine, news and video) apps. Obviously there are high costs associated with producing the content, so those high revenues don’t necessarily translate to high profits. Additionally, the higher than average median revenues for developer services on tablets may be related, since tools and platforms for content publishers on tablets are fairly popular.

The e-Commerce mystery

On the desktop web e-Commerce is a giant industry and yet we see smartphones ahead of tablets, with both quite a long way ahead of PCs for e-Commerce revenues. All the e-Commerce spending data says the opposite, with PC spending still ahead of tablet spending and smartphone spending the lowest. Perhaps the scale advantages in online retail mean that there aren’t many businesses able to compete in sub-$100k / month revenue filter we’ve applied here and there are just some niche mobile first e-Commerce solutions starting on smartphones. Indeed our top end revenue band of $500k+ in the survey is probably not large enough to reflect successful e-Commerce businesses. Possibly our survey just hasn’t attracted a representative cross-section of e-Commerce developers.

Continuous clients

Currently PC-first developers are still making the highest revenues for most types of business. Indeed, even the simple paid download model that seems to be almost dying on mobile platforms is looking fairly healthy on PCs. Tablet-first software developers aren’t yet seeing fantastic results despite the growing penetration of the iPad in enterprises and educational institutions. The giant installed base of smartphones does not yet offset the low revenues per user from what are mostly consumer apps. Mobile developers need to focus more on which users are willing to pay for software and what they’re willing to pay for in order to grow revenues. [tweetable]Mobile-first may be an excellent design philosophy but it shouldn’t also imply mobile-only[/tweetable]. Subscription-based businesses are working very well across all screens. Most developers offering subscriptions provide clients for all of the screens their customers use to access their content or service. It seems increasingly likely that the future, regardless of revenue model, will reward those who offer services that work seamlessly across all the screens a person owns, rather than focussing on one over others.

Categories
Languages

How to succeed with HTML5

Although the debate on HTML5 versus native apps seems to be favouring native apps currently, particularly in terms of user experience and performance, average developer revenues tell a very different story. Our survey data shows the mean average revenue for developers who consider HTML5 for mobile devices their primary platform is the highest of all platforms, just over twice that of the next nearest (iOS)*. However, the rewards are very unevenly shared, with the median average revenue for the same developers under half that of their iOS counterparts. Diving into the data we can see significant differences in revenue depending on how mobile apps built with web technologies are delivered to users and the categories they target. Understanding these differences could improve your chances of succeeding with HTML5.

html5

Apps but not App Store sales

The majority of developers using HTML5 in their businesses still prefer to deliver it via the browser, either as traditional websites, or more complex web apps. The range of deployment options for developers using web technology and their relative popularity is shown in the chart below. The data throughout this post is filtered to only include developers whose organisations earn between $1 per month and $5 million per month. There are a large number of hobbyists with no revenue who are excluded and we also exclude a small percentage of super-high earners who create large distortions in the averages.

It turns out this browser-centric preference, despite the protests of the open web advocates, is bad for business – at least in the short term. On average (mean and median) [tweetable]developers deploying their code as standalone apps earn 50% more than those delivering via the browser[/tweetable]. If we exclude apps for platform native web frameworks (e.g. Firefox OS and BlackBerry WebWorks) because these are only available on niche platforms, then the advantage rises to 70% (mean, or 100% median). If we also only look at those developers who consider HTML5 their primary platform then the difference is larger still (mean revenue per person per month of ~$77.5k for app delivery versus $21.5k for browser delivery).

A popular misconception is that the web has poor monetisation and app stores solved this. However, as we’ve shown previously, [tweetable]the more developers rely on app stores for revenue, the less they make[/tweetable]. Web developers are no exception, in fact, avoiding reliance on app store monetisation is one of the keys to their success. Amongst developers using HTML5 for mobile devices as their primary platform who gave us a revenue breakdown, 65% had no revenue at all from app stores and of those that did, a further 65% generated less than 50% of their revenue from app stores. Contrast this with those targeting iOS as their primary platform – 67% of them generate some of their revenue from app stores and for 50% of those it was more than 50% of their total. So where do these web developers make their money? A much wider range of sources – more contract work than most platforms, many more sales outside of app stores and also e-commerce.

The right tool for the job

It’s also clear that HTML5 is not suited for all types of app and while in the case of enterprise clients it seems browser based delivery is still slightly preferred, an app delivery method opens up many more opportunities. The interactive graph below compares revenues by category for browser and app based delivery methods.

Outside the Enterprise software and Maps & Navigation categories, the revenues are at least an order of magnitude higher for app based delivery in this subset of popular categories. The outsized revenues earned by business productivity software developers suggest that the consumerization of IT is making significant inroads into the enterprise and even the comfortable revenues of those who focus on (mobile) browser based delivery for enterprise clients may not last.

Although we shouldn’t underestimate the impact that the relative maturity of many web businesses versus native mobile competitors has on the above figures, web technology seems very far from dead as a way to capture value in the mobile software market. Our data does suggest that those who want thrive in the age of mobile should embrace the consumer preference for apps rather than rely purely on the browser to deliver their services.

– Mark

A brief note on the figures presented in the article:

* Calculated as a mean revenue per person involved in app development and excluding organisations with $0 revenue per month or more than $5 million revenue per month. This is attempting to narrow our inquiry to real app businesses rather than hobbyist developers whilst excluding a small number of outliers that distort the averages. As such this is not comparable with our published reports based on market size estimates for all developers, including hobbyists, students etc. Average revenues on iOS are still the highest if we include all developers.