
This blog is contributed to Developer Nation by Netdata
Properly monitoring the health and performance of Docker containers is an essential skill for solo developers and large teams alike. As your infrastructure grows in complexity, it’s important to streamline every facet of the performance of your apps/services. Plus, it’s essential that the tools you use to make those performance decisions work across teams, and allow for complex scaling architectures.
Netdata does all that, and thanks to our Docker container collector, you can now monitor the health and performance of your Docker containers in real-time.
With Docker container monitoring enabled via cgroups, you get real-time, interactive charts showing key CPU, memory, disk I/O, and networking of entire containers. Plus, you can use other collectors to monitor the specific applications or services running inside Docker containers.
With these per-second metrics at your fingertips, you can get instant notifications about outages, performance hiccups, or excessive resource usage, visually identify the anomaly, and fix the root cause faster.
What is Docker?
Docker is a virtualization platform that helps developers deploy their software in reproducible and isolated packages called containers. These containers have everything the software needs to run properly, including libraries, tools, and their application’s source code or binaries. And because these packages contain everything the application needs, it runs everywhere, isolating problems where code works in testing, but not production.
Docker containers are a popular platform for distributing software via Docker Hub, as we do for Netdata itself. But perhaps more importantly, containers are now being “orchestrated” with programs like Docker Compose, and platforms like Kubernetes and Docker Swarm. DevOps teams also use containers to orchestrate their microservices architectures, making them a fundamental component of scalable deployments.
How Netdata monitors Docker containers
Netdata uses control groups—most often referred to as cgroups—to monitor Docker containers. cgroups is a Linux kernel feature that limits and tracks the resource usage of a collection of processes. When you combine resource limits with process isolation (thanks, namespaces!), you get what we commonly refer to as containers.
Linux uses virtual files, usually placed at /sys/fs/cgroup/, to report the existing containers and their resource usage. Netdata scans these files/directories every few seconds (configurable via check for new cgroups every in netdata.conf) to find added or removed cgroups.
The best part about monitoring Docker containers with Netdata is that it’s zero-configuration. If you have Docker containers running when you install Netdata, it’ll auto-detect them and start monitoring their metrics. If you spin up Docker containers after installing Netdata, restart it with sudo service netdata restart or the appropriate variant for your system, and you’ll be up and running!
Read more about Netdata’s cgroup collector in our documentation.
View many containers at-a-glance
Netdata auto-detects running containers and auto-populates the right-hand menu with their IDs or container names, based on the configuration of your system. This interface is expandable to any number of Docker containers you want to monitor with Netdata, whether it’s 1, 100, or 1,000.
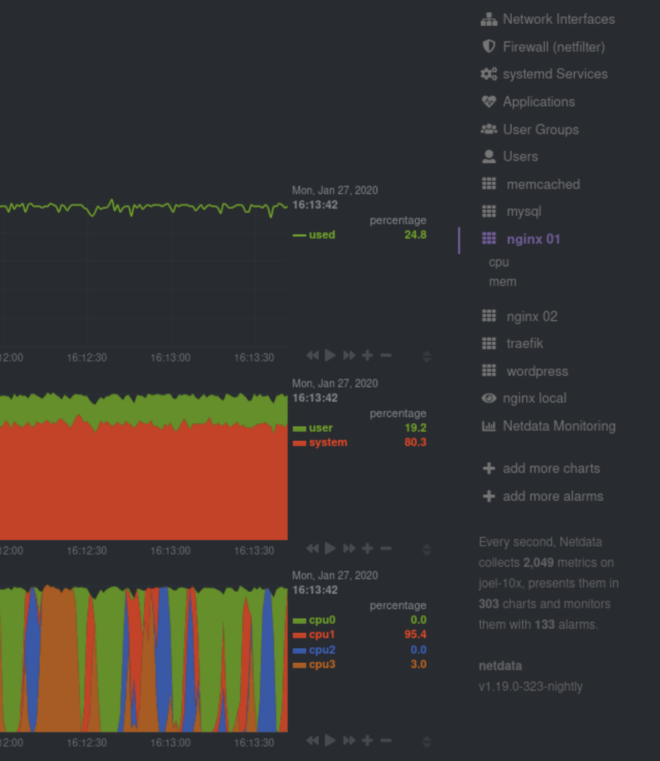
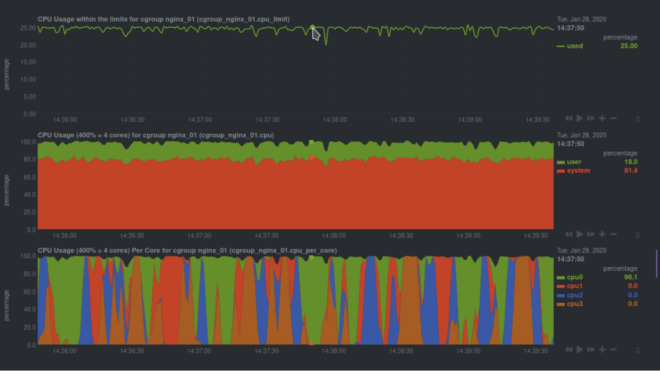
Netdata also uses its meaningful presentation to organize CPU and memory charts into families, so you can quickly understand which containers are using the most CPU, memory, disk I/O, or networking, and begin correlating that with other metrics from your system.
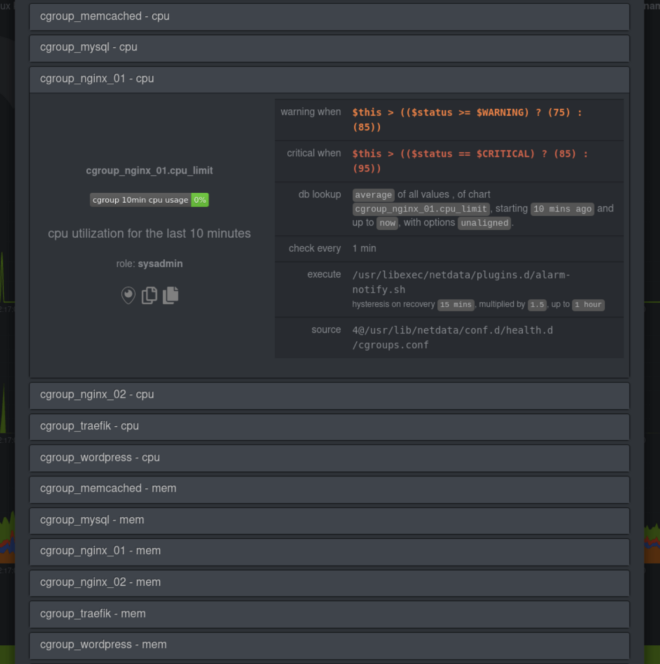
Get alarms when containers go awry
Netdata comes with pre-configured CPU and memory alarms for every running Docker container. Once Netdata auto-detects a Docker container, it initializes three alarms: RAM usage, RAM+swap usage, and CPU utilization for the cgroup. These alarms calculate their usage based on the cgroup limits you set, so they’re completely dynamic to any Docker setup.
You can, of course, edit your health.d/cgroups.conf file to modify the existing alarms or create new ones entirely.
Dive into real-time metrics for containerized apps and services
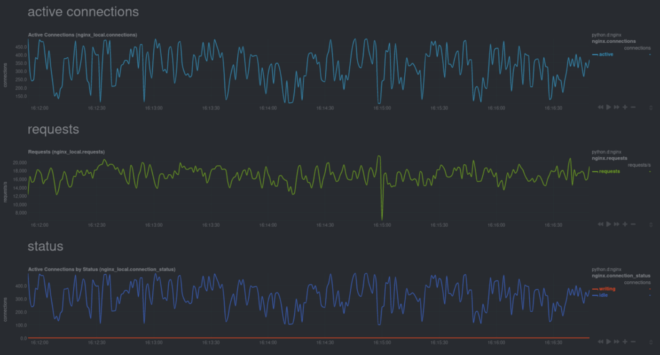
Netdata’s Docker monitoring doesn’t stop with entire containers—it’s also fully capable of monitoring the apps/services running inside those containers. This way, you’ll get more precise metrics for your mission-critical web servers or databases, plus all the pre-configured alarms that come with that collector!
You can monitor specific metrics for any of the 200+ apps/services like MySQL, Nginx, or Postgres, with little or no configuration on your part. Just set the service up using the recommended method, and Netdata will auto-detect it.
For example, here are some real-time charts for an Nginx web server, running inside of a Docker container, while it’s undergoing a stress test.
Visit our documentation and use the search bar at the top to figure out how to monitor favorite containerized service.
What’s next?
To get started monitoring Docker containers with Netdata, install Netdata on any system running the Docker daemon. Netdata will auto-detect your cgroups and begin monitoring the health and performance of any running Docker containers.
If you already have Netdata installed and want to enable Docker monitoring, restart Netdata using the appropriate command for your system.
Netdata handles ephemeral Docker containers without complaint, so don’t worry about situations where you’re scaling up and down on any given system. As soon as a new container is running, Netdata dynamically attaches all the relevant alarms, and you can see new charts after refreshing the dashboard.
For a more thorough investigation of Netdata’s Docker monitoring capabilities, read our cgroups collector documentation and our Docker Engine documentation. You can also learn about running Netdata inside of a container in your ongoing efforts to containerize everything.
