[This post by Andreas Pappas, Senior Analyst at VisionMobile, first appeared on the VisionMobile blog on April 3, 2013.]
[How do app developer revenues vary by country, or platform? Does the number of platforms make a difference to app revenues? Which models bring in the most revenues? We revisit Andreas Pappas’ November analysis of app monetisation with more insights from our Developer Economics 2013 survey across 3,400+ developers – while launching our latest survey, which is available here]
Back in November, we looked at which apps make money based on research on how app revenues vary by platform, app category, country and more. In this article we update our analysis on app monetisation based on the latest research from Developer Economics 2013 across 3,400+ app developers, including analysis that did not make it into the report.
We ‘re also proud to launch our very latest Developer Economics survey, which reaches across thousands of app developers and provides the data for our famous state of the developer nation reports. Thanks to the sponsorship by BlackBerry, Mozilla, Intel and Telefonica it possible to provide these reports and additional insights, for free, to the entire mobile community.
Take part in the survey, spread the word and help us drill deeper into the app economy and what makes it tick. We have prizes aplenty for developers, with 7 devices up for grabs (one iPhone 5, two Samsung Galaxy SIII, two Nokia Lumia 920 devices and two BlackBerry Dev Alpha handsets) – plus an AR Drone 2.0, a Nest Learning Thermostat and a Nike Fuel Band for participants who also subscribe to our developer panel. Last, but definitely not least, our friends at Bugsense are giving away one month of free crash reporting to each and every participant.
Developers in North America lead the revenue leaderboard
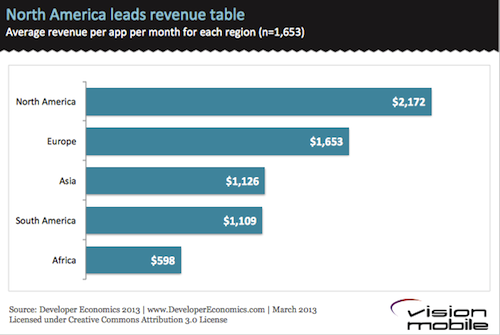
We’ll start by taking a look at income distribution by the region where app developers are based. Last time we saw that US developers earned almost double the revenue of UK developers. Based on our Developer Economics 2013 data, North America (and particularly the US) is still in the driving seat of the mobile app economy with developers in North America generating about 30% more than their european counterparts, who in turn generate 47% more revenue than developers in Asia. To some extent higher revenues for NA developers are explained by higher consumer spending in the US and higher penetration of iOS, which as we will see later on, still generates higher revenues than other mobile platforms. Note that across this analysis we are restricting our sample to mobile app developers, and have excluded the top 5% of revenue earners in order to minimise the effect of outliers.
While app development activity is booming in Asia, the average app-month revenue is quite lower than in the US and Europe, although developers in Asia develop, on average more apps and use more mobile platforms. As we explained in the previous article, there are multiple reasons for this revenue gap, but the prevailing reason is the fact that paid apps are not popular in most of Asia, the country that drives the Asian app economy. Instead, developers in Asia rely much more on advertising revenue, which, according to our findings is the least profitable revenue model.
iOS still monetising better than other platforms
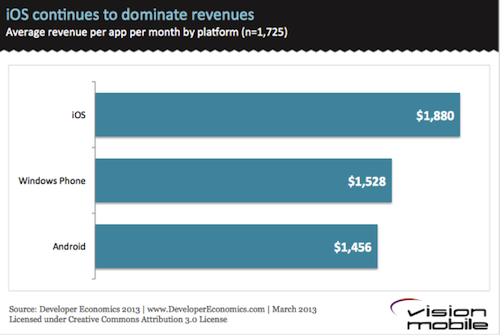
iOS continues to dominate platform revenues, generating, on average, 30% more revenue per app-month than Android. The revenue gap has reduced by 5 percentage points compared to that reported in our Developer Economics 2012 report in June 2012.
At the same time, Windows Phone has caught up with Android and seems to be doing slightly better. Although the 5% advantage is arguably within the margin of error, Windows Phone has significantly improved its position relative to the figures reported in the Developer Economics 2012 survey, when it generated, on average, about half as much revenue as Android. How has the landscape of platform monetisation changed in Q2 2013? Join the survey and help us track the state of the developer nation.
Multi-platform developers earn more
There is a wide revenue gap between developers/publishers using 6+ platforms and those using 5 or fewer platforms, with those developing for 6+ platforms generating, on average, 75% more revenue. However, only a small part of the developer population (4%) develops on 6+ mobile platforms; these are probably established services with a large footprint that want to ensure that their apps are universally available (e.g. Facebook, Skype etc.) or large software houses with a large enough pool of resources to target multiple platforms for their customers.
Those developers employing just one platform are probably solo, amateur developers or have not yet had the success that warrants (and allows) an expansion onto more platforms. As developers become more successful, they will expand onto new platforms and generate more revenue. So while, expanding on more platforms is not sufficient to generate more revenue on its own, those that do find success are likely to invest in a multi-platform strategy.
Extending apps to new markets is a profitable strategy
We asked app developers how they decided on which apps to develop or work on next and then looked at the way revenues vary depending on their strategy. While most developers will develop apps they want to use themselves (50%), this is apparently the least successful strategy and should not become the sole deciding factor for your next app.
Developers that use some form of market research such as discussing with users, monitoring apps stores or directly buying market research are much better off, generating at least double the revenue of those who just develop the apps they want to use. However, market research is not widely used among the developer population: only 24% of developers discusses with users, highlighting a lack of business maturity and also a gap in frictionless 2-way communication channel between developers and users.
Overall, the most successful developers are those that extend apps to new markets, either to new geographies or different verticals. To some extent, these strategies rely on copying the recipe of an already established and successful business: these are apps that have been tried and proven in at least one market and are generally less risky options or “low hanging fruit” for developers. Why start from the ground up when you can stand on the shoulders of giants?
The most lucrative revenue models are off limits for most developers
When talking app monetisation, there are over 10 different revenue models to chose from. Device royalties and distribution licensing fees are the top-grossing models but are quite rare among app developers due to their high barriers to entry. These models imply deals with device manufacturers and distributors which means long, expensive sales cycles and a successful app to start with. Among the rest of the revenue models, commissioned apps (development for hire) come on top since they come with a low risk and guaranteed income for developers that work under contract.
The next most lucrative revenue model is the subscription-based model but this also comes with caveats: a subscription service implies a significant investment in licensing, and maintaining quality content or services that keeps users engaged on an ongoing basis.
Among the revenue models that are most popular and more accessible to developers, In-app purchases come on top, generating, on average 34% more revenue than Freemium and 43% more revenue than Pay-per-download. In-app purchases and Freemium models are becoming increasingly popular, now being used by a quarter of developers as they seem to be appealing to consumers. We ‘re revisiting the topic of most lucrative revenue models in our latest survey. Join in and help us size the app economy.
Smart developers use smart tools
Finally, we take a look at how developer revenues correlate to the use of third party tools and services. It’s interesting to see how app revenues correlate with usage of performance tracking and management tools like user analytics and crash reporting. Developers using crash reporting and bug-tracking tools such as Crittercism or BugSense generate on average, three times more revenue than developers who don’t use these. Similarly the usage of User Analytics (e.g. Flurry, Apsalar) services is also associated with much higher revenues, with those using user analytics services generating 168% more revenue than those who don’t.
Both user analytics and crash reporting services are used by experienced developers who recognise the importance of optimising for user acquisition, activation and retention, while reducing in-the-field crashes and the resulting user churn.
Track the state of the developer nation
[tweet_this content=’App developer? Take the new Developer Economics survey and win prizes!’ url=’ http://www.visionmobile.com/
And don’t forget to fire away with those comments, rants, criticism, praise or simply feedback on what you ‘d like to see next.
Andreas (follow me on twitter @PappasAndreas)


