Categories
Tools

Cross-Platform Tools – Does it pay to use them?

In our January 2013 Developer Economics Report, we revealed that multi-platform developers are better off. Our survey data also reveals, rather unsurprisingly, that users of cross-platform tools (CPTs) target more platforms than those building separate apps for each platform. Of those interested in making money, users of CPTs target 4.33 platforms (3.1 mobile platforms) on average vs 3.46 platforms (2.57 mobile) for those building separate apps. We also know that the most popular class of CPTs (using web authoring languages) tradeoff app capability to get the increased portability. At the same time, popular opinion on the internet and amongst venture capitalists is that a cross-platform user experience can’t compete with using the platform native frameworks. So how do these tradeoffs translate into revenue for CPT users?

CPT users make more revenue

On average, CPT users make slightly more revenue per app per month than developers not using such tools. With the reduced cost of development provided by the CPT, this suggests that they’re significantly more profitable.

Averages can be deceiving where the distribution of results is far from normal, as with app revenues, so it’s worth examining the details. App revenue is heavily concentrated at the top end of the market, with a large fraction of the (mean) average coming from a small number of very high earners. If we exclude all developers earning more than $50k per app per month then the result holds – CPT users still generate more revenue.

Not all CPTs are created equal

There are also several different types of CPT. Games have been responsible for close to half of all app revenues (at least those generated directly through app stores) and since they typically don’t require many platform-specific APIs or UI elements, they’re a good candidate for building with cross-platform. This suggests that users of primarily games-centric CPTs like Corona, Unity 3D & Marmalade might be responsible for the out-performance of CPTs, while users of the low development cost tools taking advantage of web authoring languages, such as PhoneGap, Appcelerator, Brightcove & Sencha, generate slightly lower revenues. However the data shows that the opposite is in fact the case.  Users of the games-centric CPTs are generating below average revenue, whilst the web-centric CPT users are significantly better off. These results also hold whether or not we include those earning over $50k per app per month.

A plausible explanation for this is that most of the larger and more successful game developers are managing their own cross-platform compatibility or code re-use whilst many smaller independent game developers relying on 3rd party tooling are struggling with the fierce competition in the games market. At the same time it seems that, when it comes to revenue, a fully native user experience and native performance are not as important as their proponents suggest. The very high earners using web-centric tools are most likely to be existing publishers selling their content through mobile app subscriptions and our revenue estimates are probably too low, since the top income band in our survey is everything over $100k per app per month.

Both ends of the revenue spectrum

For several CPTs in our survey we didn’t have enough respondents to be sure differences in revenues for individual tools are statistically significant, however, there are a couple of individual ones worth highlighting. At the low end, revenues for Qt developers were significantly below average – this probably reflects the fact that Qt does not yet have official support for iOS or Android (planned for this year). At the high end, although we only had a relatively small sample, revenues for Brightcove App Cloud users were more than 3 times the average making the difference statistically significant, whether or not we include those generating over $50k per app per month. Brightcove appear to be focussing their solution on a particularly profitable market segment.

Tool selection – do it for the right reasons

Finally, if you’re looking to select a CPT, make sure you do it for the right reasons. Main selection criteria including access to native APIs and the ability to create a native UI look and feel are correlated with above average revenue, whilst the availability of third party extensions and choice of authoring languages are correlated with below average revenue. The former criteria look to minimise some weaknesses of the cross-platform approach whereas the latter criteria focus on reducing one-off costs. The latter are not necessarily bad reasons for choosing a tool but if they are amongst the most important reasons for your selection then it’s worth re-evaluating priorities. Work out what will enable the creation of the best product at acceptable cost rather than simply minimising cost. If the lowest possible development cost is critical to make the app concept viable then it’s probably time to come up with a higher value concept.

Categories
Business

How to Get App Ideas

How do you decide what app to build next? Paul Graham wrote an excellent post about the related problem of finding an idea for a startup. Paul says:

The way to get startup ideas is not to try to think of startup ideas. It’s to look for problems, preferably problems you have yourself.

The very best startup ideas tend to have three things in common: they’re something the founders themselves want, that they themselves can build, and that few others realize are worth doing. Microsoft, Apple, Yahoo, Google, and Facebook all began this way.

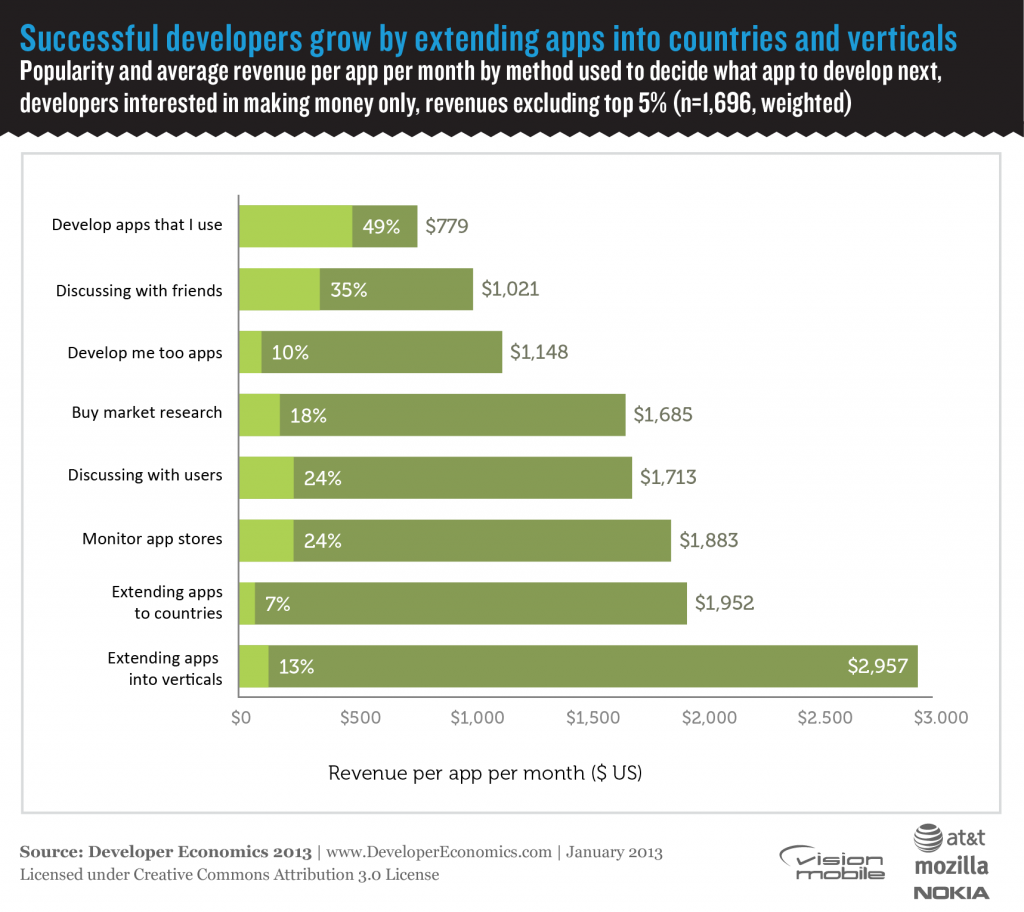
However, it should be noted that when Paul Graham says “startup” he does not mean any new company, only the hyper-growth variety that are often funded by venture capital. It should be noted that the vast majority of these companies fail. So, if you’re building a business around apps and are aiming your sights a little lower than “the next big thing” then our survey suggests that solving your own problems might not be the best option. 49% of developers build apps they want to use themselves, but end up generating the least revenue.

Beware survivorship bias

The following data should be interpreted carefully, some of the most successful strategies are only viable for larger publishers, or only available for those who already have a successful app – this creates survivorship bias. However, there appears to be a strong correlation between more carefully researched methods of deciding what app to develop and financial success.

Developer Economics 2013 - Successful developers grow by extending apps into countries and verticals

Business side of apps is harder than the technology

Almost half of developers (49%) in our survey decide which apps to develop based on their own needs. Those same developers end up generating the least amount of revenue per app per month, indicating that they have a lot to learn in how they plan their app business. Naturally, planning a business based on own needs may yield a good customer understanding, but lacks the rigor of market research or of extending proven app recipes into new countries or verticals.

User feedback is effective but hard to get

We find it remarkable that only 24% of developers in our sample plan their apps based on discussions with users, a figure which does not change with development experience or proficiency. This indicates that the bottleneck of the build-measure-learn cycle of lean development is the “measuring”, or listening in to user needs. This highlights the need for a frictionless 2-way feedback channel between developers and users, much like what GetSatisfaction pioneered for web apps, and which now HelpShift is pioneering for mobile apps.

Market research pays off

To decide which apps to build, a sizeable share of developers uses market research and competitive intelligence. Market research and competitive intelligence are well-established practices in business development and we expect that the increasingly business-savvy developer population will, in the near future, invest more effort in these elements when designing a product strategy.

Bigger publishers have more options

Developers that publish more apps per year tend to make decisions based on different criteria than those publishing only a few apps per year. For developers publishing 16+ apps, the decision mainly lies with clients or management – these are mostly professional developers that work on commissioned apps or as employees of larger publishers where the decision on which app to work on is mainly based on a defendable business case. Developers publishing more apps also tend to rely on market research more, whether that is purchased research or own research through app store monitoring and analytics services.

Build on success

The most successful strategies are those that extend an app into markets, either into verticals or different geographies. To some extent these strategies rely on an already established and successful business: these are apps that have been tried and proven in at least one market and are generally less risky options or “low hanging fruit” for developers.
[doritos_report location=’DE13 Article – App Ideas’]

Categories
Business

How Price Changes Can Improve Revenues

Distimo recently published an interesting report (free, registration required) on how app price changes affect revenue for iPhone & iPad apps. They give a breakdown on the scale of price changes but only give the really interesting results – the download and revenue impacts – averaged across all price changes. The key result is that download volumes and revenues are significantly positively impacted by price drops and negatively impacted to a lesser degree when the price rises again.

Although not specified by Distimo it’s likely that the vast majority of price rises are simply prices returning to normal after an offer ends. In this context it’s worth bearing in mind that e.g. an app with 1000 downloads/day increases on average to 9710 downloads/day after 5 days following a price drop. When the price goes back up again, the downloads fall by 57% of the increased total, e.g. back to 4175.

Demand at zero price

A factor that is not accounted for in the Distimo analysis is the discontinuity in demand at zero price. Ideally the effects of price changes that make an app free should be analysed separately from those which do not. In the former case, demand at zero price is typically multiples of demand at any non-zero price; a free promotion also relies on generating revenue from in-app purchases, advertising or subsequent increased demand after the promotion ends. On the other hand, price changes which do not make an app free are trading off price against volume. Developers can experiment with these changes to find the price point which generates maximum revenue. For most apps the marginal cost of serving additional users is close to zero and certainly dwarfed by the cost of creating the app. In this scenario, maximum revenue equals maximum profit. The zero price effect also suggests that any price drop intended to increase downloads for the purposes of increased visibility in the store should be a free promotion for maximum impact.

Longer term impact

The Distimo report shows revenue growth (purely from downloads and in-app purchases) continues for at least seven days from a price drop, reaching an average of 71% increase for the iPad and 159% for the iPhone. Beyond seven days we have a much smaller dataset from the App Rewards Club (and their analysis of Free App A Day) which suggests an initial revenue spike follows the end of a free promotion but the longer term increase in revenues is only minor, questioning the fees charged by some free promotion services.

Beware frequent sales

If a key component of your revenue model is paid downloads and temporary price drops create spikes in revenue, along with slightly increased revenue in the long run, it’s tempting to think that frequent sales will ratchet up your earnings bit by bit. The truth is likely the opposite since there are multiple services that allow consumers to check the price history of a premium app; if there are regular sales many users will simply wait for the next one. There was a good review of the issues with sales on the app store last year, however, ignore any claims that it’s impossible to succeed with premium pricing – even in the most competitive category, games, one of the most successful apps is MineCraft, priced consistently at $6.99. Most of the other top ranked premium apps either don’t have sales at all, or only do so around significant events (new major versions, holidays, new device launches).

All of this data was for iOS. According to Distimo, Google Play also shows similar effects on price changes but of a smaller magnitude due to the greater difficulty of reaching top rankings. However, the subject of price promotion on Android is much less relevant, since paid downloads make up such a tiny fraction of overall revenues.

Categories
Business News and Resources

Two Important App Market Trends to Watch in 2013

2012 was another big growth year for the app market. Apple continued to launch new products, sell them in ever greater volumes and distribute more revenue to developers. Meanwhile Google overhauled their market and developer revenues climbed sharply. Android developers also saw the Amazon Appstore expand and become a serious second revenue source. Developers who created quality apps and marketed them well were richly rewarded. However, for many developers the major challenge of getting their apps discovered by users only got worse. How is 2013 likely to compare and what are the most recent app market trends? Will app revenues continue to grow at similar rates and will those revenues keep concentrating in the hands of fewer publishers?

App market trends: Continued Growth

According to Distimo’s 2012 report, Apple’s daily App Store revenue grew 21% in the four months to the end of November. Google Play revenue grew 43% in the same period. During November the average daily revenue from the App Store was $15m while for Google Play it was $3.5m. So Google has more than double the growth rate, although from a much lower base.

The graph below extrapolates those four month growth rates exponentially through 2013. This illustrates the effects if those growth rates continued – this is not a prediction.

The Apple daily revenues and growth rate figures were taken during a double new product introduction spike, so the actual 2013 growth is likely to be significantly lower. According to App Annie, iOS revenue growth for the first 10 months of 2012 was only 12.9% total.

Similarly Android’s revenue growth in 2012 was from a very low base, it will be important to watch how it changes as the absolute revenue levels increase. The likelihood is that Android revenues will be significantly closer to iOS revenues by the end of 2013 but iOS revenues much closer to where they are now than the graph above suggests.

In the biggest spending app markets around the world, smartphone penetration is above 50%. A large proportion of smartphone purchases in those markets in 2013 will therefore be replacement devices running the same platform. With iOS a new device can download purchased content and restore in-app purchases at no extra cost. On Android it’s entirely up to the developer whether existing purchases can be used on a new device but by default, paid apps can be downloaded to new devices and in-app purchases will not be restored automatically without charge.

App revenue expectations

Will users continue to spend on apps at the same rate on replacement devices, or will the app revenues in the most developed markets start to fall? There’s likely to be some variation here across platforms and app categories but this may be the first year that the total market growth doesn’t obscure this important user behaviour trend.

App market trends: Revenue Distribution

Although the app stores are generating millions of dollars in revenues every day, those are not distributed at all evenly amongst developers. Canalys recently highlighted that 50% of revenues are earned by just 25 publishers in the US. Although we already pointed out that this is not as bad as it sounds, since those publishers have well over 1000 apps between them, at the very top, the concentration really is that extreme and getting worse.

According to the 2012 report from Distimo linked above, 7 apps were responsible for 10% of revenues on the iPhone in November, for the iPad it was only 6 apps and on Google Play just 4. At the very top on iOS we know that Supercell were grossing $500k per day from two games in early October. At the time Hay Day, the lower ranked of the two, was below position 20 in the top grossing chart, while it is now rarely outside the top 10. Clash of Clans has consistently been in the top 2 since that report. We can guess their revenue is even higher now and that the number 1 grossing spot is worth somewhere around $300-450k per day (about 2-3% of total iOS revenues) before Apple’s 30% cut.

In January 2012 the top 11 apps for the iPhone were responsible for 10% of revenues while on the iPad it was 8 apps. It’s tempting to speculate that the greater increase in revenue concentration on the iPhone is due to the changes to the App Store in iOS 6. However there is very little overlap between the top 10 grossing apps and the top 10 paid or free downloads. Whatever the reasons for this increased concentration of revenue at the top, this is an important trend to watch in 2013.

If revenues aren’t more evenly distributed amongst a larger number of developers then investment in new app projects must eventually start to decline. Otherwise, developers will need to find more business models that aren’t dependent on direct monetisation of their apps through stores.

If you are interested in more recent trends, have a look into our App Developer Trends from Q1 2015.

Categories
Business Platforms

Multi-Platform Developers Are Better Off

Our latest survey shows a concentration of developer attention around the iOS/Android duopoly. Given the reach and revenues available on the two leading platforms compared to the competition, it’s unlikely that developers will find significant success without targeting one or both of them. However, our survey data also shows that developers should not limit themselves to those two platforms. There is a strong correlation between average revenue and the number of platforms targeted.

Developer Economics 2013 - Multi-platform developers generate higher revenues

74% of developers use two or more platforms concurrently. At the same time, developer platform choices are now narrowing. On average mobile developers use 2.6 mobile platforms in our latest research, compared to 2.7 in 2012 and 3.2 in our 2011 research. The Android-iOS duopoly in smartphone sales is gradually creating a concentration of developers around these two platforms: 80% of respondents in our sample develop for Android, iOS or both, making them the baseline in any platform mix. Developers that do not develop for one of these two platforms generate, on average, half the revenue of those developers that do, leaving little doubt as to the concentration of power within these two major ecosystems.

In our Developer Economics 2013 survey of over 3,400 developers we found that 49% of developers use just one or two mobile platforms concurrently and 75% use up to three mobile platforms. The number of platforms developers use depends to some extent on which is their lead platform. In mobile development, loyalty to one platform is not something that pays off. Our research shows that the revenues are higher when using more platforms. For example, an iOS developer porting an app on Android is likely to experience some growth in revenue. At the same time, for developers working on four or more platforms, higher revenues are probably the result of extending an already successful app to more platforms. Obviously, this is not something that all developers can afford to do; it is a strategy more suited to large publishers or commissioned developer teams that are large enough to support a number of platforms.
[doritos_report location=’DE13 Article – Mulit-Platform’]

Categories
Community

Developer Economics 2013 Survey: iOS vs Android shoot-out

iOS is the best platform for generating revenue,
Android provides a better development environment

Developer Economics 2013 - Android vs iOS shoot-out
We asked developers to pick the top platform, among all platforms they have used or are planning to use, on a number of different aspects of mobile development such as discovery, learning curve and monetisation. We then compared how iOS and Android fare against each other, based on the opinions of developers using both platforms.

The outcome is a tie when it comes to user base, with developers’ opinions divided between the two platforms. However, iOS was ranked higher on 4 out of the six remaining categories, with a clear advantage on app discovery (50% iOS vs. 23% Android) and revenue potential (66% iOS vs. 12% Android). The perception that iOS provides better monetisation opportunities is well engrained with developers and is backed by Developer Economics 2013 survey data. App discovery has developed into a problem for both platforms given the size of their app stores, which now well exceed 700,000 apps. However, despite some initial complaints about the new curation model on App Store, the developer verdict is quite clear on app discovery, which goes to iOS. iOS also leads, but with a smaller margin on development environment and documentation & support.

Android has a clear advantage on development cost (32% Android vs. 14% iOS) and a small lead on the learning curve ( 26% Android vs. 20% iOS). However the total score for the two platforms on the latter two aspects was lower than 50% indicating that most developers that use both Android and iOS believe that neither is best in these areas. In fact 24% of developers among those using Android and iOS indicated that HTML is the best platform in terms of learning curve while 7% indicated that its Windows Phone.

For most developers, the platform perceptions boil down to a decision about which platform to prioritise, i.e. where to invest more resources and which of the two platforms to develop for first. Several other factors may come into play when making a decision on the “lead platform”, such as prior experience or local demographics, but it is fair to say that iOS comes out as the winner in developer perceptions. This is consistent with our figures on lead platforms: among developers using iOS and Android, iOS is the lead platform for 42% of developers, while Android is the lead platform for 31% of developers.

[doritos_report location=’DE13 Article – iOS vs Android shoot-out’]

Categories
Business

Which apps make money?

[This post by Andreas Pappas, Senior Analyst at VisionMobile, first appeared on the VisionMobile blog on 13 November 2012.]

[Andreas Pappas takes another look at the results of VisionMobile’s Developer Economics 2012 survey and comes up with interesting new insights on app monetisation: how does app revenue vary by app-category and by country? Is there a correlation between time spent developing an app and they money it makes?]

VisionMobile - which apps make money

In Developer Economics 2012 we discussed app revenues and how they vary across platforms. We found that overall, around half of all app developers that are interested in making money did not earn a sustaining income, i.e. they were below the “poverty line”, which we drew at $500 per month per app. Of course the real poverty line will vary widely across countries and regions: while $500 per month may not be enough for a San Francisco-based developer, it could be more than enough for a developer based in Bangalore where average living cost is less than a third, according to Numbeo.

Categories
Business

Different Ways of Winning on the App Stores

A recent report from Canalys highlighted the extreme concentration of income distribution across the iOS and Android stores in the US. The top 25 publishers make 50% of the revenues. 24 out of 25 of those are games publishers (the 1 exception is the Pandora music streaming service). During the first 20 days of November these 25 publishers made $60m from paid downloads and in-app purchases in the US alone. Is there still room left for smaller publishers? How can smaller companies succeed and start winning on the app stores?

Categories
Platforms

The yellow brick road of app store monetisation

[This post on App Store monetisation by Andreas Pappas, Senior Analyst at VisionMobile, first appeared on the VisionMobile blog on  31 July 2012.]

Apple and Google dominate the app store game – but only in terms of size. Senior Analyst Andreas Pappas discusses the key success factors for app stores, why Google is lagging behind and how Amazon fits in the whole picture.

With Amazon challenging Google’s app market and Apple allegedly offering the best monetisation potential, several developers and analysts have put these claims to the test by comparing monetisation data across the three app markets. Differences in monetisation potential can have a significant impact on developer mindshare: developers will seek to leverage platforms that will make them more money.

Categories
Business Platforms Tools

Is the Era of Microtransactions in Free Mobile Games Over?

W3i, the in-app offer exchange provider, released a report on December 6th showcasing recent trends in mobile app monetization. The W3iNSIDER Report breaks down data from its hundreds of game developer partners and 66 million monthly active users across iOS and Android.The data shows that smaller microtransactions ($0.99-$1.99), long thought to be the backbone of the freemium model, actually contribute significantly less revenue to mobile games than more expensive in-app purchases that range from $9.99 to $19.99.

When surveying the in-app purchase price points and how they contribute to the overall revenue of a sample of games, W3i found that, on average, 47 percent of total revenue comes from purchases costing $9.99 to $19.99. Smaller purchases from $0.99 to $1.99 only contribute an average of six percent to total game revenue.

The freemium model emerged as the foremost business model in mobile gaming with premium and subscription business models declining. The freemium model is built on the back of microtransactions with gamers spending a dollar or two to unlock virtual goods.

W3i is also reporting in-app purchasing trends from around the world:

  • The highest-spending region in the world is the United Arab Emirates- with 77 percent of revenue of revenue coming from $19.99 (55 percent) and $9.99 (22 percent) IAPs (as of Oct 2012)
  • The UK has the highest number of whale spenders- with eight percent of revenue coming from $49.99 IAPs sizes as of Oct 2012
  • $.99 IAPs sell the largest volume in China and Canada where they each make up about three percent of purchases

“Although the U.S. learned about freemium gaming from Asia, it’s apparent that Americans are taking their own approach to it,” says Robert Weber, co-founder of W3i. “Where mobile games in Asia still depend on microtransactions, U.S. gamers play more like whales- spending larger amounts of money in mobile games.”