Categories
Business

Are you using the right app revenue model?

The most popular revenue models appear to be those that are easiest to implement. The developers using them tend to have lower revenues. This may be due to greater competition or it might just be a result of less sophisticated app businesses producing less valuable apps. There are some interesting differences between platforms but [tweetable]subscriptions appear to be a relatively untapped gold mine everywhere[/tweetable], although maybe not for everyone.

VMMoneyNote2_800

Revenue models versus average revenues

Our research shows some significant variation in average developer revenues depending upon the revenue models being employed. An investigation of the relative popularity of revenue models versus revenue generated across the major platforms produces some useful input for app development strategy and planning. Unsurprisingly, the simplest revenue models to implement, like paid downloads and in-app advertising, tend to be the most popular. The often repeated stereotype that “Android users don’t pay for apps” also leads to a strong preference for ad-supported apps on Android, while iOS developers prefer paid downloads. Slightly more surprising is that although Android has a larger user base who seem less inclined to pay up front for their apps, freemium and other in-app purchase schemes are less popular than on iOS. It would seem that on average [tweetable]iOS developers are more sophisticated in their approach to the app business[/tweetable].

Revenue distribution

When considering revenues it’s important to note that the distribution of revenues in the app business is highly concentrated at the top and there are a lot of hobbyists who earn nothing. We exclude most hobbyists, those who’ve not started earning revenue yet, the mega-rich chart toppers and large publishers from our analysis by only counting developers with between $1 per month and $5 million per month in revenues here. Even so, there is a fairly large “middle class” of smaller independent developers with a lot of users and high revenues. As such there’s a massive difference between mean and median revenues even in this subset.

The revenues shown in the chart above don’t necessarily all come from the platform or revenue model they are linked to – [tweetable]developers use multiple revenue models and multiple platforms[/tweetable]. For example, amongst developers who target iOS first the in-app advertising model appears to do much better than for those who target Android. Although iOS advertising rates are higher, this isn’t the primary cause, since very few of our iOS respondents derived most of their revenue from ads. The actual reason is that many of those using ads also used a freemium upgrade model (presumably paying to remove the ads and possibly add features) and derived a significant fraction of their revenue from that also. The same strategy does not appear to work as well on Android. Although not entirely accurate, we’ll refer to revenues by platform and revenue model as a shorthand in the rest of this post because it’s a reasonable approximation in most cases.

Less popular, more people, more revenue

Interpretation caveats aside, one thing that seems clear from this data is: [tweetable]the more popular the revenue model, the less successful the developers using it[/tweetable]. The exception here is contract work, which shows much higher revenues on iOS and lower on Android relative to its popularity. Although there’s some evidence that contract development rates for iOS are slightly higher, the difference is mostly due to where the platforms are most popular with developers. Otherwise, most revenue models show slightly higher mean revenues on Android but significantly lower median revenues. There’s also a link between the average number of people involved in app development in an organisation and the revenue model. More people involved, may signal more complex development for the associated apps. The fact that this is also associated with increased revenue is possibly related to using the extra development complexity (or team size) on a more sophisticated revenue model. It is not the case that more people involved results in higher average revenues per person in general. In fact, there is a very strong peak in mean revenue per person for organisations with 6-10 people involved in development – there are probably some significant efficiency losses above this size.

The subscriptions gold mine

Across both Android and iOS, [tweetable]subscriptions generate by far the highest mean revenues[/tweetable]. Median revenues for subscriptions are also higher than every revenue model except contract development. At the same time, only just over 10% of developers use a subscription model and the average number of people involved is lower than for all but the simplest revenue models. Mean monthly subscription revenues for Android-first developers are 3 times higher than for their iOS-first counterparts. It seems that Android users not paying doesn’t apply to subscriptions. However, median monthly subscription revenues on Android are less than half those on iOS, so there are a smaller number of very big winners with Android-first subscription businesses.

Should more developers be trying to build subscription-based businesses? Almost certainly yes, but they’re not for everyone. While 53% of developers using the paid download model and 45% of those using in-app advertising are in 1-person companies, that’s only the case for 20% of subscription businesses. In fact 53% of the subscription businesses in our survey had more than 5 people, not all of which are directly involved in app development. This is because many popular subscriptions include continuously updated content and there’s significantly more work (and cost) involved in providing ongoing content for subscribers. Our survey has also shown that money is not a primary motivator for lots of developers and managing the content side of the business may not be something they’d want to be involved with. For entrepreneurs looking to build successful app businesses, the subscription model is definitely worthy of further investigation.

– Mark

Categories
Tools

Advertising is the most popular developer service, AdMob dominates (65%)

Advertising is the most popular developer service

Among those developer services that we benchmarked the most popular is ad networks and exchanges, reflecting the widespread popularity of advertising as a revenue model. Advertising is the most popular revenue model, while ads can also act as a promotion channel that facilitates app discovery.

With advertising being the most widely used revenue model among developers, advertising services attract considerable developer interest taking the top spot among the developer tools that we benchmarked. Providers of ad services monetise their service by taking a direct cut of advertising revenue generated by developers. With 100+ ad networks and exchanges, there is intense competition, regional specialisation and niche solutions. In spite of this, several ad services are not profitable.

The services we benchmarked are either advertising networks that provide direct access to their own pool of ads or ad exchanges (aka mediation engines, not real-time bidding exchanges) that act as aggregators, automating access to a large number of individual ad networks. Ad exchanges offer some flexibility to developers by allowing them to select between multiple ad networks through a single SDK – offering better fill rates and eCPMs. At the same time, ad network SDKs often provide access to more features available, than the generic features available through an ad exchange.

Ad services are most popular with Windows Phone and Android developers

Among developers using Ad services, 27% use an exchange, however, just 16% utilise an ad exchange as their primary ad platform. Most developers using ad services use just one service (61%), 25% use two services and 14% use three or more services. Overall, developers use 1.59 services on average. There is quite a large variance in the number of developers using ad services depending on the scale of development: those developing less than 5 apps per year tend to use ad-services much less than those developing more than 5 apps per year. Among developers that develop more than 16 apps per year, most likely working for large publishing houses, software services companies or agencies, about 60% use ad services in their apps.

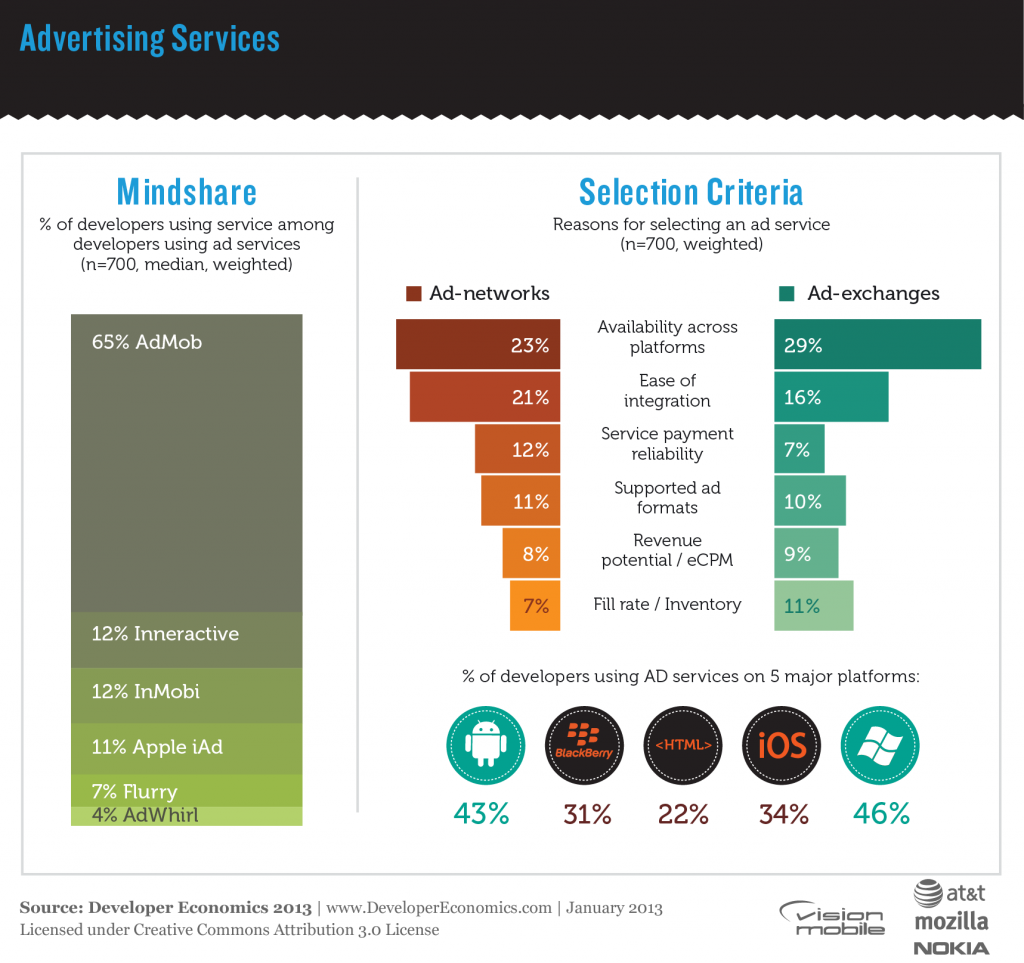
Ad services are most popular with those who develop primarily on Windows Phone and Android (46% of WP developers and 43% of Android developers), and less so on iOS and BlackBerry (35% and 31% respectively). This is in agreement with our findings on revenue models being used on each platform, with developers on Android and Windows Phone relying heavily on advertising to monetize their apps.

DE13-16-01

AdMob dominates ad networks (65%) and Inneractive leads among ad exchanges (12%)

AdMob, a service acquired by Google in 2010 is clearly the dominant platform in mobile ad services, adopted by 65% of developers that use ad services. AdMob has recently expanded to ad exchange services, a move that aims to counter the threat that ad exchanges pose for Google. Second runners, each used by 12% of developers, are Inneractive, an ad-exchange/mediation service and InMobi, an ad network growing out of India to become a major player in emerging markets: InMobi’s mindshare is 17% in Asia and 33% in Africa. Apple’s iAd service comes fourth overall with 11%, and despite being quite popular among iOS developers, AdMob is the leading ad service on iOS, used by 66% of iOS developers that we surveyed.

Ad exchanges are complementary to ad networks. For example, developers will use one service with high eCPM but low fill rate and another with lower eCPM but nearly 100% fill to plug the gaps in the better paying service. When selecting an ad network or exchange, availability across platforms comes on top in both cases. Ease of integration is also very important, particularly so for developers using ad networks. Supported ad formats, revenue potential and fill rate are secondary selection criteria, and therefore differentiation factors across advertising services.

[toggle title=”Important things to know about this interactive graph”]

  • All the filters in the graph refer to survey questions in which respondents could select multiple answers. This means that there is no direct link between the filter and the use of the tool. For example, filtering on “Android” means that the respondents develop Android apps. It doesn’t imply that they use the tools for their Android apps specifically, or even that the tool supports the Android platform. Use filters as a guideline only.
  • Keep an eye on the sample size. If the sample size is low, the graph doesn’t offer strong conclusions about the popularity of different tools. Use your good judgment when making decisions.[/toggle]

    Find the best ad service for you!

    [sectors slugs=’ad-networks-exchanges’]

Categories
Business

Does Cross-Promotion Work?

The concept of app developers banding together and promoting one another’s apps in order to increase awareness and download numbers for all concerned makes a lot of sense. Beyond developers promoting their own apps, or a couple of friendly developers getting together and agreeing a deal between themselves, it can get difficult to decide what’s fair with the wide variation in active user bases and engagement across apps. This suggests there’s a clear place for independent brokers to step in and create a market, which a large number have done. Some solutions offer direct trade in promotions between apps but most are simply app-specific advertising networks, charging developers to advertise and paying them for displaying ads. They key difference with pure ad networks is that ads are tracked right through to subsequent install (and sometimes app open) before any payment is made, rather than just a click on the ad.

When viewed as just another form of advertising, with a cost-per-action model, in theory this should work out fairly well for developers. User acquisition costs are predictable for advertisers and those displaying ads have reasonably good targeting built-in before any extra targeting logic used by the cross-promotion network – everyone viewing the ad has a smartphone and downloads apps on it! How does the theory work out in practice?

[sectors ids=’45’]

More users, more revenue

On average developers using cross-promotion networks (CPNs) have larger user bases and make more revenue than those not using such networks. Restricting our analysis to those developers interested in making money, able to report their revenue to us and earning less than $50k per app per month (the handful earning more than this will be discussed later): the average number of active users for the most popular app of those using CPNs was 181,800 vs. 76,600 for those not using CPNs. For the same groups, the average revenues were $3457 vs. $2487 per app per month respectively. As with most things related to the apps market, averages can be deceiving – 56% of developers using CPNs earn less than $500 per app per month. So while cross-promotion clearly works, the better question is who does it work for?

Higher CPI, more users & revenue

We asked developers using CPNs what their typical cost-per-install (CPI) was, without differentiating between usage of the networks as an advertiser, publisher of ads or both. Given this lack of differentiation it’s interesting to note that there’s a strong correlation between CPI and revenues, as shown in the graph below.

It’s also interesting to note that when you include the very highest earners, only $0 install costs and those above $1 are affected. Presumably very successful developers can and do effectively use some of these third party tools to cross-promote their own apps. Whilst it’s extremely likely that only those developers earning high ARPU (and thus almost certain higher than average revenues too) can afford to buy users at >$1.00 per install, it’s not at all obvious that those earning a higher CPI would be earning more revenue in total. Indeed with pure ad networks the reverse is almost true – high earners often have very low eCPM. This suggests two possible explanations, either there is a “high value” end of the market for cross-promotion where successful apps both advertise and publish ads, or only advertisers are making good money and the CPNs are taking a large cut.

High value customers, high value promotions?

Within our survey data there’s a clue that such a high value sub-market exists within cross-promotion networks. We asked developers about their reasons for selecting the networks they use; of all the reasons given, only two were correlated with significantly above average earnings for the sector. Both “Revenue share”, a publisher concern, and “Targeting options”, an advertiser feature, were correlated with more than 2.5 times the sector average revenue. A lot of the very low revenue apps using cross-promotion appear to be primarily targeting a low-income demographic (teenagers) who are unable to buy paid apps or in-app purchases directly and are therefore willing to earn them by either watching ads, downloading other apps or performing actions within them. It’s logical that these apps don’t generate a lot of revenue for publishers or advertisers. On the other hand, apps targeting more affluent users who do pay real cash for their app usage will be attractive cross-promotion partners for developers of other similar apps.

This really just comes down to basic business sense – if you want to make a decent amount of money, build things for people that have it to spend. It’s possible to make up for very low ARPUs with volume but it will require lots of apps and lots more work. Whichever route you decide to take it appears that cross-promotion is a viable monetisation option. If you’re aiming at low-ARPU users it may be that cross-promotion networks are your only advertising option but you’ll also need to find other marketing channels to get enough scale.

[doritos_report location=’DE13 Article – Does Cross-Promotion Work?’]

Categories
Business Tips

How to Optimise Ad Revenue

On the surface, advertising seems like a fairly simple and easy to implement business model for an app. Decide on some places to display ads, integrate one or more third party ad services and wait for the money to start rolling in. If you do this without a clear plan for how and why users will interact with ads in your app you’ll probably find the revenue disappointing. Optimise revenue by growing your user base, increasing engagement and improving your fill rate (how many of your possible ad slots actually show an ad) and eCPM (effective cost per thousand impressions). The challenge becomes apparent when you try to improve these metrics and find them somewhat opposed to one another. Show too many ads and users either use your app less or abandon it altogether. Make the ads smaller or display them less prominently and your click-through ratio (and hence eCPM) goes down. Show a lot of irrelevant ads (higher fill rate typically has less relevance on average) prominently and users start ignoring all of them by default. Make your ads prominent and they’d better be relevant. If it’s hard to target your audience well then keep the advertising low key and count on volume to make up the revenue. It turns out that getting the right balance is very difficult and not many developers manage it.

Higher eCPM != higher revenue

A very small fraction of developers in our survey managed to achieve truly exceptional eCPM’s, greater than $5, sometimes even more than $10. These developers were almost all making multiples of the average revenue in total but they were also using more than one revenue model. It’s likely that most of their revenue was coming from another source and they showed very few highly relevant ads to get those rates. If we focus on the developers who only used advertising as a revenue model then those with eCPM’s below $0.25 were earning significantly more on average than those with eCPM’s from $0.25-1.50. So, for the majority of developers, those with higher eCPM’s make less money. To add to the confusion, size of active user base is also very weakly correlated with ad revenue; the simple concept of getting more users to make more money from ads doesn’t work on its own either.

Why iOS developers make more with ads

A good illustration of the complexity is to compare iOS and Android developers. As reported by several ad networks, iOS gets a higher eCPM on average than Android. However, our survey data suggests that the difference is all at the very high end. If we exclude the developers with eCPMs over $5, iOS actually has a lower eCPM than Android. For those only monetizing via ads, Android developers had a 37% higher eCPM and while the iOS developers only had 20% larger user bases on average, they earned almost 75% more revenue every month. This suggests that the iOS developers were seeing very much higher engagement with their apps and thus delivering many more ad impressions.

The fallback network fallacy?

There’s some popular advice that in order to maximise ad revenue, developers should use at least two ad networks, one with a high eCPM and low fill rate and another with a lower eCPM but very high fill rate. The theory is that this ensures they get the most relevant targeted ads with the best rates when they’re available but still don’t waste the inventory by filling it with less relevant lower paying ads when they don’t get filled by the premium network. This fallback strategy sounds logical but does it work? There’s some possible support for this in the fact that developers using more than one ad network make slightly more money on average than those who only use one (and 70% of developers purely monetizing through ads only use one network). However, this seems more likely to indicate greater sophistication than successful use of the fallback strategy. The ads from the two different networks are unlikely to fit the same presentation, positioning and format within an app well. There’s some fairly strong evidence against this fallback strategy within our survey data – developers with eCPMs above $5 are excluded from the following sample and so are those earning greater than $50k per app per month in revenue due to the disproportionate effect both tiny minorities have on averages.

Note that 67% of developers using ads selected neither eCPM nor fill rate as reasons for choosing their ad networks and that percentage is mirrored in the group only using ads for monetization. Those that selected one criteria or the other but not both generated slightly higher eCPM than average and significantly higher revenues. Developers trying to maximize both metrics to squeeze the maximum possible revenue out of the advertising space in their apps generated the highest eCPM but did far worse than average on revenues.

Optimise for engagement

This data suggests that developers should pick an appropriate advertising style for their app and try to go for either quality or volume of ads displayed but not both. Considering that the most popular advertising services use a cost-per-click model, the highest eCPMs are likely to simply reflect higher click-through ratios. In many cases the taps on ads may be accidental. Ads getting in the way of the content or usage of an app result in fewer users or lower usage and thus lower revenue. It seems that by far the best way to optimise ad revenue is to build app experiences that people want to spend a lot of time using and make sure the ads don’t spoil them. The extra volume of impressions generated by tens or hundreds of thousands of engaged users will more than make up for lower eCPMs or ad inventory not getting filled.

Categories
Business

How Much Is An Active User Worth?

App store analytics providers have been telling us that almost all of the growth in app revenues in the last year has been through in-app purchases. However is that just because the model has become more popular? Or because revenue has been concentrating at the top of the market where the strategy is very popular (particularly in free-to-play games)? Probably a bit of both but it’s also the case that subscriptions and in-app purchase do produce the highest overall revenues. If you exclude the developers of top apps (anyone earning over $50k per app per month on average and with over 500k active users) then it turns out that aside from apps that provide enough value to justify a subscription model, the important thing is acquiring users and keeping them engaged. The average revenue for an active user is fairly constant, regardless of the monetization method.

How much do you think is an active user worth? Take the Developer Economics Survey and have your say!

For the purposes of our survey, freemium could be a limited free app with a separate paid version promoted by the free one, or a free app with a premium upgrade via in-app purchase. In-app purchases can be any content, features or virtual goods purchased in the app, which itself can be paid or free. Paid downloads, advertising and subscriptions are hopefully self-explanatory. Note that it’s possible (and indeed quite common) for developers to use multiple revenue models, either on separate apps or within the same app – e.g. freemium with advertising in the free version. The average number of revenue models per developer in the sample above was 1.7. However, if we only look at developers using a single revenue model, the pattern is very similar (and average revenues are lower across the board).

Make the core functionality free if you can

For the majority of developers, an active user is worth around $0.04 per month. All other things being equal, unless you have a sufficient reputation or well known brand association that you can get paid downloads in large numbers, then it’s better to avoid the user having to pay directly for the core functionality of your app. This results in more downloads and a larger user base. Freemium comes out badly here, it seems that the free trial may get lots of downloads but overall slightly fewer active users (and paying users) than a straight paid download. Advertising and in-app purchases had almost identical user bases and overall revenue. Subscription apps had the smallest active user bases but by far the greatest revenue, however, this revenue model requires some kind of ongoing service that is external to the app, which will have associated costs.

In-app purchase beats advertising at the top end

The picture is a little different if you include the highest earning apps. At this point paid downloads fall far behind, both in terms of ARPU and overall user base and revenues. This is not to say you can’t have a very high grossing app with a pure paid download approach (Minecraft is a great counter-example), just that the probability of doing so is much lower. Subscriptions still come out on top but not by so much. The lower ARPU for subscriptions at this level suggests that the top subscription apps have a very popular free tier. Freemium does slightly better than paid downloads for active user base size and significantly better for revenues, suggesting that top quality paid apps with a higher price may sell better with a free trial of some kind. Finally, in-app purchases and advertising both generate the largest active user bases by offering their core functionality for free but a well designed in-app purchase scheme beats advertising for monetization by some distance.

Beware service costs eating all your revenue

In addition to revenue model selection there are also implications here for apps which connect to backend services. The average monthly revenue from an active user needs to exceed the costs of providing the service significantly to make a profit. If the majority of developers are only making $0.04 per user every month on average then say a Kinvey (purely because they price per user for iOS and Android, making the comparison easy) BaaS at $0.03 per user (for 200-5000 users at current pricing) does not leave much for the developer.


In-app purchases or ads?  Take the Developer Economics Survey and have your say! You may win awesome new gear.

Categories
Business Platforms

Mobile Advertising from MoPub & Opera

MoPub, a real-time bidding exchange for mobile advertising, recently published a report on their marketplace for the third quarter which shows some strong trends. The effective cost per thousand impressions (eCPM) was steady or rising across platforms through the last quarter. Android eCPM was rising much faster than for iOS. This is in sharp contrast to the rather dramatic decline in eCPM for smartphones between Q2 and Q3 evident in Opera’s reports, with Android falling faster than iOS.

Categories
Business Platforms

Flurry’s AppSpot reports average eCPM of $5.80 across interstitial, video and banner ad formats

From TechCrunch:

App measurement and ad company Flurry has revealed significant traction for its iOS and Android app advertising and targeting platform, AppSpot. The platform was made publicly available in October 2012 and has attracted more than 1,000 app publishers to sign up in just over three weeks, according to the company. Flurry described revenue performance of the first 500 applications already live as “very strong”, with an average eCPM of $5.80 across interstitial, video and banner ad formats.

Categories
Business Tips

50+ mobile revenue models

This hackpad (a collaborative list composed by 150 people) has an impressive list of web and mobile revenue models, ranging from the classic ad-driven models and pay-per-download to intermediaries and commerce models.
For Your Inspiration.

Categories
Business Tips

Developing for Android? You better choose your ad network wisely!

SwiftKey, makers of a third party keyboard for Android, joined up with two technology publications to survey over 17,000 smartphones users about the number of paid applications they have on their devices. Back in 2011, 12% of Android owners said they had zero paid apps on their phone. Only 10% had 20 or more paid apps. This year, those figures are now 7% and 19% respectively. Translation: Android users are slowly becoming more willing to pay for apps, but if any serious money is to be made here then you’re going to have to make free apps that are ad supported.

Categories
Business Platforms Tips

11 revenue models that bring in more cash

Developers have a range of options to choose from when it comes to generating revenue. This choice is, to some extent, dependent on business model, scale and target market. Which revenue models are most popular, and which are most profitable?


Key insights and recommendations:

  • Selling your app B2B (commissioned apps or pre-loaded on a handset) is typically much more lucrative than selling the app directly to users through app stores.
  • Models with recurring revenue from users (subscriptions, in-app purchases) come out ahead of the ‘traditional’ models like pay-per-download, freemium or ad-supported. Despite this, they’re less popular with developers, although in-app purchases are on the rise across platforms.
  • You can use multiple revenue models concurrently. It’s not an either-or decision. On average, app makers use 2 models concurrently.
  • Your choice of revenue model should be tuned to the category you’re in and the platform you’re using.
  • For iOS, an opportunity exists to produce expensive niche apps. Also, in-app purchases are more popular on iOS than on other platforms.
  • It’s more difficult to make money on Android. Your best bet is commissioned apps or a subscription model.
  • The viability of revenue models changes extremely fast. Keep a constant eye out for trends in your category.

Related tools: In-app purchasing and virtual goods | Ad networks and mediation engines