Categories
Business Community

Developer corner: Lessons from a one-man app business

For the last two and a half years I’ve been building and selling apps directly on the iOS App Store, however only in 2014 I committed to some substantial effort on this. I’d like to share some numbers about my experience last year and draw some insights about what things went well and which ones didn’t.

Hopefully this analysis will be useful to others and will give me some insight about where to focus in 2015 to grow my app revenue.

How do you monetize your apps? Take the Developer Economics Survey and let us know. You may win awesome prizes and gear.

one-man-band

Apps Summary

January 2014 brought along my most successful app so far: My Oyster. This app has been in development since October 2013 and even though it had a rough start on the first few months of the year, it is now my most consistent app in terms of downloads and revenue. Along with it, I started selling My Oyster Pro as a 69p ad-free alternative as I wanted to evaluate how well the freemium and paid pricing models would work for the same app. As it turns out, this paid version contributes to sales figures comparable to the ones of the freemium app.

Alongside this, I have been working on improving Camera Cube, which has been live since 2012 and takes the second spot for this year on revenue. Most notably, I released a major update with iOS 7 compatibility in July and added support for iPhone 6 and 6 Plus in December.

In August, I also released Perfect Grid as an iOS port of a simple puzzle game I previously made for Android.

Finally, in November I launched Pixel Picker, my first app written in Swift!

Alongside these new entries, my two old apps Puzzle Camera and Camera Boom are still live on the App Store, however I have not been updating them this year.

My App sales numbers in 2014

Total Revenue
Paid Downloads
IAP Revenue
Ad Revenue
£ 584.23 £ 151.80 £ 199.21 £ 233.23

AppAnnieRevenues2014

App Annie Yearly Revenues 2014 – Source: Musevisions blog

The first important observation is that 86 % of my total revenue comes from the My Oyster and My Oyster Pro apps which both went live in January and brought in 504.86 £ by the end of the year. Overall the freemium version accounted for 70% of these sales (fairly equally split between in-app purchases and ad revenue) and the paid version for the remaining 30% of sales.

This shows that the choice of differentiating my revenues across advertising, in-app purchases and paid downloads has paid off and I plan to keep all these streams going for My Oyster in the future and try them with my other apps as well.

AppAnnieRevenueGraph2014

App Annie 2014 Revenue Graph – Source: Musevisions blog

The graph above shows how my revenues have changed over time during this year. For various reasons, I had to remove My Oyster from sale during the January, February and April timeframes, and this shows clearly in the revenue graph.
For the rest of the year, revenues have been varying between 1.5 to 2£ per day on average and peaks of 4 to 6£ per day.

Expenses

In 2014, the costs of running my app business have been as follows:

Apple iOS Developer Program: 60.00 £
Domain Hosting: 102.47 £
Facebook Ad Campaign: 200.00 £
Outsourcing services: 408.69 £
iOS icons pack: 16.10 £
Total Expenses: 787.26 £
Total Revenue: 583.86 £
Net Loss: 203.40 £

The biggest expense has been some outsourcing work I’ve done to create UI artwork for my apps, however this was necessary to create some high quality UI elements and I’m happy with it.

Marketing

This year I have tried a few marketing strategies to give my apps more visibility. These three have been the most effective:

  • Keywords optimisation Particularly for My Oyster, the number of downloads has had a high correlation with the ranking of the keyword “Oyster” in the UK App Store. The app has been ranking third for this keyboard through the whole year and averaging 50 to 70 downloads per day.
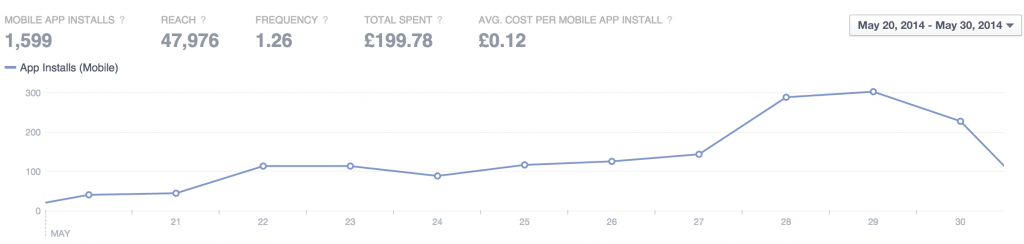
    On one occasion it jumped up to second spot due to one of the competitor apps being temporarily removed from sale and the downloads spiked to over 300 a day as a result. This shows that direct search ranks are fundamental for user acquisition on this app.
  • Facebook advertising In an attempt to get My Oyster to the top of the UK Travel rankings, I ran a Facebook Ad campaign in the London area for 10 days, allocating 12£/day initially and spiking this to 40£/day towards the end. The campaign succeeded in boosting the app from position 200 to the top 50 in the UK Travel category, however as soon as I stopped the campaign, the ranking dropped again to its previous levels. With a cost per mobile app install of 0.12£ and an average revenue per download of 0.01£, I would have had to generate 12x more revenue per download, or decrease the cost per install by 12x in order to break even with this strategy.
  • Hacker news I have promoted Perfect Grid and Pixel Picker by sharing the apps’ iTunes links on Show HN and asking some friends to upvote them. I did this for Perfect Grid on the day after launch, managed to get 14 upvotes and stay on the Hacker News front page for a few hours, but this only resulted in 180 downloads on that day, which I presume could be attributed evenly to Hacker News traffic and the app just having gone live.
    Pixel Picker fared much better and managed to get 2200 downloads in one day, largely attributable to Hacker News traffic.

MyOysterRanks2014

My Oyster UK Travel Ranks 2014 – Source: Musevisions blog

MyOysterFacebookCampaignMay2014

My Oyster Facebook London Ad Campaign May 2014 – Source: Musevisions blog

MyOysterDonwloadsMay2014

My Oyster Downloads May 2014 – Source: Musevisions blog

PixelPickerHackerNewsNovember

Pixel Picker Downloads generated by Hacker News traffic, November 2014 – Source: Musevisions blog

Additionally I have been spreading the word about new releases of my apps on Twitter and Facebook, however I haven’t noticed an increase in downloads as a result.
Writing to bloggers to request a review for My Oyster also proved ineffective and a big time drain so I’m not going to invest more effort on this going forward.

Overall, I have been quite impressed at the number of downloads that a high traffic site like Hacker News can generate, however in my experience this only helps in getting a spike in downloads. I haven’t yet found a way to sustain high download numbers over time, other than through paid advertising which is an unsustainable model given my current ROI.

Going forward I’d like to share my apps on other high traffic sites such as Product Hunt and Reddit, as well as trying other advertising platforms.

User Engagement

So far, My Oyster is the only app that shows promising engagement metrics with around 5000 MAU and good retention rates:

APP
Period
AVG session
duration (min)
Monthly active
users
Returning
Users (%)
New users
per month
My Oyster November 6.47 5441 94.4 2116
Pixel Picker December 2.06 738 41.1 575
Camera Cube November 1.18 681 50.0 N/A
Perfect Grid November 3.05 98 86.1 N/A

Having around 640 daily active users and an average session duration of over 5 minutes, My Oyster performs much better than my other apps in terms of ad impressions and revenue.

MyOysterAdsReport2014

My Oyster Ads Report 2014 – Source: Musevisions blog

As outlined in the graph above, My Oyster received 3000 clicks at a cost per click of 0.06£. Next year I plan to experiment with Ad Networks other than AdMob to determine if a higher CPC is achievable.

Customer Support

To facilitate user feedback, all my apps have a help/about screen with an option to contact customer support via email.

One peculiar aspect of the My Oyster app is that it lets users check their Oyster card data which comes from a 3rd party website. As the content can be unavailable at times and users sometimes have issues with their accounts, some time is required to answer customer emails, so the revenues from this app aren’t completely passive.
The positive side of this is that a lot of customers get in touch with me directly and their feedback helps me improving the app over time.

As download numbers and engagement metrics are not good for my other apps and I very rarely receive emails from customers that have downloaded them, I can infer that those apps are not as discoverable as I’d like them to be and they don’t generate much interest from customers. From a business perspective perhaps I should focus on My Oyster instead and try to grow its user base and functionality.

Conclusions

As many others have noted, [tweetable]bootstrapping a consumer app business on iOS is hard[/tweetable]. My personal experience so far has been that from a purely financial standpoint this is unsustainable and I should be investing my time in something more lucrative like consulting, which at the time of writing brings in 30x to 50x more revenue per hour worked.

However, I believe there are a lot of intangible benefits in making and publishing apps:

  • They make for a good portfolio Prospective clients will be able to assess the quality of my work and my apps always help me getting jobs and consulting gigs.
  • I keep acquiring new skills Making apps is by nature a creative process, and I have the freedom to choose all the latest tools and technologies for the job at hand.
  • Full product lifecycle Making apps forces me to think about the whole product: development, UX, support and marketing.
  • Flexible workload I get to choose how much or how little I work on my apps, as well as choose what I want to work on. For me this is very valuable as I can enjoy working on these side projects without having too much pressure.
  • I get to talk at events Sometimes I feel it’s worth sharing my findings and experiences as an app developer, and this also is beneficial for building my brand and network.

Goals for 2015

In 2014 I was hoping to hit and maintain 100 £ in revenue per month. I have missed this mark by about 50%.
As most of my revenue came from the sales my My Oyster, I plan to focus on further developing this app and try a few more marketing channels to improve its visibility.

While I plan to do some more independent app development in 2015, my app business so far has struggled to take off and I feel that I could invest more of my time in other relevant activities, including:

  • Open Source development I’d like to focus more on creating small and reusable iOS libraries and components and share them with the community. I find that such projects are very well suited for giving presentations of technical nature. Additionally, I’m reading a lot of stuff on functional programming and I can’t wait to share a lot of functional stuff on my GitHub page.
  • More consulting work I see consulting as an opportunity to see what challenges companies face and work on problems that I would not have the chance to take on as an indie developer.
  • Write technical material, courses and seminars This could be a new exciting venture for me and I feel that there is a great community around iOS development and software programming in general. As I become a better developer, I’d like to share some of the lessons I learnt in a format that can be most useful to others. Further down the line, I would like to start running my own courses and seminars.

Time will tell how things will go, but I feel very privileged to be an iOS developer in 2015 I can’t wait to build more products and awesome stuff this year!


Which skills do you want to develop? Take the Developer Economics Survey and we will compare your skills to the global average. You can work on those skills and maybe get your lucky break.

Categories
News and Resources Platforms

The Three Waves Of Mobile Marketing

With over one million apps in the Apple and Google stores, you‘d think that app development has become business as usual. As we enter 2014, the making of apps is a sought-after commodity. But [tweetable]the marketing of apps remains part art, part science[/tweetable].

shutterstock_114890851

App marketing and advertising took off early in the history of the app economy. The freemium model (generally speaking, apps that are free but monetize through premium upgrades, in-app purchase items or advertising), took place a couple years after. On the App Store, in-app purchase items (IAPs) were only introduced as of late 2009. On the Google Play Store, they had to wait until 2011.

Since the freemium app model started making a name for itself, the parameters and requirements of app advertising and user acquisition have been in constant evolution, strongly influenced by transformations of the app ecosystems. In particular, app publishers, marketers and other stakeholders have constantly needed to adapt to the evolving policies and barriers enforced by Apple and Google.

In fair consideration, many of the steps the two companies took were also in reaction to the evolution of advertising techniques and practices within their ecosystem. The dynamic is therefore mutual.

Looking back on the brief history of app marketing, there are three main phases or “waves” of app marketing, presented in the table below. Each phases has distinguishing features in terms of business objectives, marketing strategies and practices, technology focus, transparency standards, platform regulations etc.

The three waves of mobile app marketing:

1st wave 2nd wave 3rd wave
Timeframe 2009 – 2011 2012 – present 2013 – present
Goal Volume through top chart position Volume with a focus on the price of installs Volume with a focus on the quality of installs
Marketing strategy Incentivized Downloads Shift to quality: Non-incent ROI-positive media buying
Pricing Methods
  • Flat fee
  • Cost Per Click
  • CPM
Cost Per Install
  • Cost Per Action
  • Cost per Reengagement
  • adjusted CPI (aCPI)
Technology focus None
  • Install attribution tracking
  • In-app analytics
  • Post-install, in-app event tracking
  • Programmatic buying
  • Deep linking
  • (Cross-device) Retargeting
Tracking technology
  • iTunes Connect
  • UDID matching
  • MAC Address
  • openUDID
  • Fingerprinting
  • Platform-specific device identifier (IDFA, Advertiser ID)
  • Social Media login
Level of platform regulation and transparency Low Medium High
Market dynamics Emergence of new “pure” players Growth, stronger positioning of existing players Consolidation, M&A activity, older players start getting involved
Advertising formats Banners, editorial advertising, incentivized Interstitials, video ads Native ads

I’ll discuss these three waves along their most important characteristics.

The first wave: the early days, focus on volume

The early days of app marketing date back to 2009. They were characterized by the emergence of the Apple App Store as the main platform for user acquisition. [tweetable]Publishers mostly relied on the top chart rankings to gain visibility[/tweetable]. This led many of them to resort to the so-called burst campaigns, either incentivized or natural such as editorial app “boosters” and blogs. These campaigns generated large amounts of downloads in a short period of time in order to climb the app store rankings.

In this context, performance models, whereby advertisers only pay for the installs generated, mostly served for incentivized campaigns, and burst campaigns were often sold on a flat-fee basis. For the burst campaigns run on a Cost Per Install (CPI) basis, downloads were accounted for using iTunes Connect data or at best UDID matching. Consequently, there was neither technology focus nor need in terms of tracking. In short, user acquisition was not data-driven.

During that time, many pure players, such as Tapjoy, Flurry, or AppGratis, entered the space, as it was a land grab with low barriers to entry. Platform regulations were still relatively lenient, as the tenants of the ecosystems didn’t wish to curtail their growth. For instance, incentivized downloads were still allowed by Apple until April 2011.

The second wave: focus on quality and performance tracking

The second wave of app marketing started around 2012. The volume remained the main marketing objective, but CPI-based campaigns gained momentum and performance marketing started becoming widespread. More generally, a discrete shift towards more quality tracking in advertising campaigns was taking place.

In terms of regulation, Apple tightened its grip on a fast-growing ecosystem and cracked down on players accused of taking advantage of the top chart ranking algorithm. In April 2011, incentivized downloads were banned and in October 2012, Apple enacted clause 2.25, forbidding “Apps that display Apps other than your own for purchase or promotion in a manner similar to or confusing with the App Store”. This led to the ban of several of app discovery services, the most famous being App Gratis which was pulled from the Apple’s store in March 2013. App publishers themselves suffered the consequences of these restrictions, such as Animoca who, in January 2012, saw all their apps removed by Apple under the allegation that they were using bot farms to generate fake downloads.

Technology-wise, the growing popularity of performance marketing encouraged the rise of efficient attribution tracking solutions, in order for advertisers to trace downloads down to their respective sources. Among the tracking technologies which then emerged, the most popular are fingerprinting as well as single, platform-specific device identifiers (Google’s Advertiser ID and Apple’s Identifier For Advertisers – IDFA). As of today, [tweetable]fingerprinting remains the only legitimate solution enabling mobile web tracking[/tweetable].

Publishers also started becoming more data driven by integrating in-app analytics solutions such as Localytics to analyze usage, retention, engagement, virality and monetization metrics. Similarly, a focus grew on measuring the quality of the users through the estimation of customer lifetime value (LTV). However, this was at this time mostly performed to understand the user journey and improve the user experience, not yet (so much) to optimize user acquisition campaigns. In other words, [tweetable]performance stopped at the install, as in-app and attribution tracking remained distinct from each other[/tweetable].

In terms of market dynamics, the wave of new entrants stalled as existing advertising players consolidated their positions and stronger regulations prevented the use of shadier advertising tactics. The second wave was pioneered by ad networks (inmobi, AdMob, Leadbolt), affiliate and cross-promotion networks (AppFlood, Chartboost, AppLift), mobile agencies (Fiksu, Somo Global).

The third wave: focus on lifetime value and ROI

The third wave of app marketing started in 2013, is currently unfolding and will probably define the mobile landscape for at least the next two years. This third wave is distinguished by a massive shift towards quality, with, in particular, the growing realization by mobile advertisers that acquiring users, even at a low price, makes no sense if these users are not retained, engaged and finally monetized.

This global shift to quality has generally been embraced by advertising companies, app publishers and platforms alike, all with various consequences.

First, platforms themselves are taking on and driving the trend, and introducing heightened regulation. In 2013, Apple modified its ranking algorithm to take into account more in-app, post-install qualitative factors such as retention and engagement metrics. Google, too, started enforcing harder restrictions on its developer policies when it banned spammy user acquisition techniques such as push notifications or icon drops on the Play Store.

Naturally, it is app publishers and advertisers that are driving the largest part of the shift. Indeed, increased competition as well as rising CPI prices has made it an impediment to track and optimize user acquisition campaigns more accurately, and to allocate marketing budgets towards the best-performing channels. Technically, this means tracking post-install events, connecting them to the acquisition source, and finally linking attribution tracking to in-app metrics.

Early assessment of the LTV of acquired users now enables advertisers to quickly assess the quality of the various acquisition channels used. This in turn allows them to optimize and fine-tune the campaigns by allocating budgets to the traffic channels offering the highest user quality (users whose LTV is higher than their cost of acquisition – CPI).

On the whole, if the first wave focused on volume only and the second on price-weighted volume, the third wave is characterized by quality-filtered volume.

In the wake of this quality shift, new pricing schemes appeared: for instance, [tweetable]Cost Per Engagement (CPE) now allows advertisers to pay for actions taking place after the install[/tweetable], such as game tutorial completions, or first purchase.

More quality and more regulation also go along more trust and transparency. In the specific context of the relationship between advertisers and user acquisition networks and other partners, this means that networks have been more willing to share information about their traffic sources, while advertisers have been less reluctant to share more in-app data about the users generated.

In terms of market dynamics, the third wave is characterized by increased M&A acquisitions as older, established digital and online companies start acquiring pure mobile players. This way, in 2013 we saw, among others, retargeting company Criteo buy out mobile tracking company AD-X, Twitter snap up mobile ad exchange MoPub and, in gaming, Japanese telecoms firm Softbank together with GungHo acquire Finnish mobile game publisher Supercell. There were also a couple of mobile-only deals, such as the acquisition of Jumptap by Millennial Media or the merger of mobile gaming services company Playhaven with mobile analytics provider Kontagent.

As the third wave of app marketing is still forming, other data-driven approaches are emerging, such as real time bidding, retargeting and cross-device targeting. Reactivation and re-engagement campaign techniques are already taking into account quality factors and focusing on post-install events.

For developers, it can be of great help to keep this history of paid mobile user acquisition in the rear-view mirror as they strive to understand and adapt to its new challenges.

– Thomas

[Thomas heads up content marketing at AppLift, loves scrutinizing the developments of the mobile industry and collects photo apps on his iPhone the rest of the time. He can be contacted at tso@applift.com]

Categories
Business Platforms

Mobile Gaming And The Pyramid Of Scarcities

Distimo - App Revenue Distribution

According to Distimo’s latest report, apps with “freemium” business models, i.e. free apps monetized by in-app purchases (IAP), have dominated revenue charts in 2013. This spurred me to take a deeper look at the “economics of free” and explore new opportunities for innovation in these business models.

The Economics of Free

Let’s begin by taking a brief look at the “Economics of Free” or the “Economics of Abundance”, as described by Mike Masnick. Here’s a short, 2 minute video introducing the concept:

Economics is essentially a social science that examines the best possible way to allocate “scarce” goods or resources, i.e. ones with meaningful marginal cost and limited supply. However, digital goods like apps are abundant because the marginal cost of creating an additional copy is zero. Given the nature of near-efficient competition in the digital world, price naturally approaches the marginal cost of zero.

This explains the decline in popularity of paid app downloads and the decline of numerous traditional business models. However, cheap or free content allows developers to reach a much wider audience which consequently increases demand for related scarce goods or resources. In the music industry, the advent of digital music precipitated a steep decline in US recorded music sales from $14.6 billion in 1999 to just $6.3 billion in 2009, but concert ticket sales grew from $1.5 billion to $4.6 billion over the same timeframe. In other words, digital music converted a scarce resource (recorded music albums) into an abundant resource (cheap, easily downloadable singles), which then increased demand for a related scarce resource, i.e. concert tickets.

  1. Marginal Cost – Cost of producing an additional unit
  2. Efficient Competition – Participants do not have the market power to set prices

The Pyramid of Scarcities

This particular study focuses on scarcity-driven monetization opportunities available to developers of free-to-play (F2P) games like Candy Crush Saga, Angry Birds, etc. As shown in the image below, the scarcities created by F2P games can be segregated into 3 categories, in order of increasing scarcity (or decreasing availability)

  1. Induced Scarcity
  2. Scarcity of Goods
  3. Scarcity of Time or Access

Pyramid of Scarcities

1. Induced Scarcity

Induced scarcity is one that does not exist in reality, but is created artificially — for example, in-app purchases of digital goods. The availability of these goods isn’t really in question and therefore, the value placed on each purchase or transaction is quite low. Consequently, effective monetization depends on maximizing transaction volume from these low-value digital goods, i.e. micro transactions. This strategy is most effective when scarcity is induced because of direct player engagement, and not when it is forced onto players. Game design plays a critical role here as in-app purchases need to be naturally blended into gameplay elements. King’s games like Candy Crush Saga are perfect examples as players pay for boosters to help them progress through difficult levels. In fact, King’s revenue is expected to top $1 billion this year, almost exclusively driven by micro transactions on Facebook and mobile games.

However, exclusive use of this monetization strategy also brings up some challenges. King’s “Games Guru”, Tommy Palm, recently said that 70% of the players on Candy Crush Saga’s final level “haven’t paid anything”. While this is a great sign for consumers, King seems to be losing out on monetizing their most engaged players and biggest fans (excluding a minority population of “whales”). The only reason these players haven’t become paying customers is because they don’t consider digital goods to be scarce enough. The solution isn’t to create “paywall” equivalents, but to explore additional monetization opportunities with even scarcer products.

2. Scarcity of Goods

Scarcity of goods refers to physical products that have a tie-in with an F2P game — for example, branded or licensed merchandise. Since physical goods aren’t as abundant as digital ones, the value placed on each transaction is automatically higher. However, this comes with the trade-off of lower transaction volume. Rovio’s Angry Birds franchise is a great example of a successful merchandising strategy. Led by sales of Angry Birds plush toys, merchandising and IP sales made up 45% of Rovio’s $195 million revenue in 2012. This year, Hasbro sold over one millionTelepod” figures within a month of Angry Birds Star Wars II’s launch. This year, King also dipped its toe into merchandising with a range of Candy Crush themed candies and socks.

These products are likely to appeal to fans of F2P games even if they have never purchased digital goods. However, the biggest fans and most engaged players may be looking for something even scarcer.

3. Scarcity of Time or Access

Scarcity of time or access can be leveraged through a direct connection with the most ardent fans — for example, events like gaming competitions or conventions. Conventions tap into scarcity of time from key personnel like game designers, while social gaming competitions tap into scarcity of access to exclusive benefits and direct competition with other “superfans”. The monetization opportunity from events is likely to be immense, even though the actual frequency may be low.

So far, very few game developers have utilized this particular strategy — a related example from the non-F2P space is Mojang’s Minecraft Convention or MineCon. 7,500 tickets to the event sold out in roughly 5 minutes, generating roughly $1 million in revenue. This may seem like small change for large gaming companies, but it’s important to keep in mind that Mojang may view MineCon as more of a promotional event. Expanded ticket sales and advertising partnerships could easily make gaming events a significant revenue opportunity. Given the competition in allied industries like mobile hardware, there will certainly be no dearth of advertisers.

Opportunity for Innovation

The monetization opportunities outlined in this post show that the free-to-play mobile gaming industry still has a lot of room for growth. Most publishers have focused on just one of these strategies and I have no doubt that we will see more business model innovation from these companies as we move forward.

Having said this, these strategies are only useful for companies if their games remain popular. The gaming industry has proved again and again that companies cannot rest on the laurels of a single mega-hit. Therefore, developers need to focus on continuous innovation across a wide catalog of games. What’s most important is to ensure that players have fun. After all, isn’t that the entire point of playing games?

– Sameer

This post was originally posted in Sameer’s Tech-Thoughts blog – you can find the original article here.

Sameer is a business strategy professional with expertise in mobile ecosystems, asymmetric business models and disruptive innovation. Over the last 6 years, he has held various roles in strategy consulting, investment management, M&A and venture capital. During this time, he has developed a keen interest in the intersection between technology, innovation and business strategy. You can follow his work on his blog at Tech-Thoughts, on Twitter @sameer_singh17 or on LinkedIn.

Categories
News and Resources Platforms

Appsfire Infographic illustrates once more difficulty to get to the top

Appsfire Infographic shared figures for the iOS App Store in 2012.

  • The growth in the amount of apps, while still high, seems to be slowing. This might indicate that the market is maturing.
  • Only 1 in 10 apps gets any reasonable traction at all. Only 1 in 1000 manages to get to the top 10 of the App Store. For non-games, only 1 in 1690 reaches the top.
  • The percentage of paid apps has dropped dramatically.

Here is the Appsfire Infographic:

AppsFire 2012 - A year in the App Store