Categories
Tips

Backend-as-a-Service Shootout (the best alternatives to Parse?)

Using a Backend-as-a-Service (BaaS) can reduce development cost and time-to-market. It’s a simple way of getting a highly scalable backend solution without significant upfront investment. This avoids the technical risks of having to scale your own service to meet demand as your user base grows; in a world where an app that hits the store top charts might gain more than a million new users before you complete your next iteration of development this is worthy of serious consideration. In most cases the tradeoff is giving up control of your backend. This tradeoff was brought into the spotlight recently when the most popular BaaS, Parse, was acquired by Facebook. This created a predominantly negative reaction from developers who went from buying a service from a neutral party to hosting their backend with someone many already distrust that has an interest in mining their app data. So, if you’re looking for a BaaS for new project but don’t want to share your data with Facebook, or want to migrate away from Parse, where do you go? Our last survey asked developers using BaaS offerings to rate their primary tool against a range of criteria – the results could highlight some attractive alternatives.

Splitting out the 8 tools which had more than 10 ratings each, the “other” category is still almost 25% of responses and includes a further 11 tools that developers had selected as their primary BaaS. Our own sector page lists 43 vendors at the time of writing, suggesting that the sector is still very fragmented and likely to see consolidation in future.

BaaS Shootout

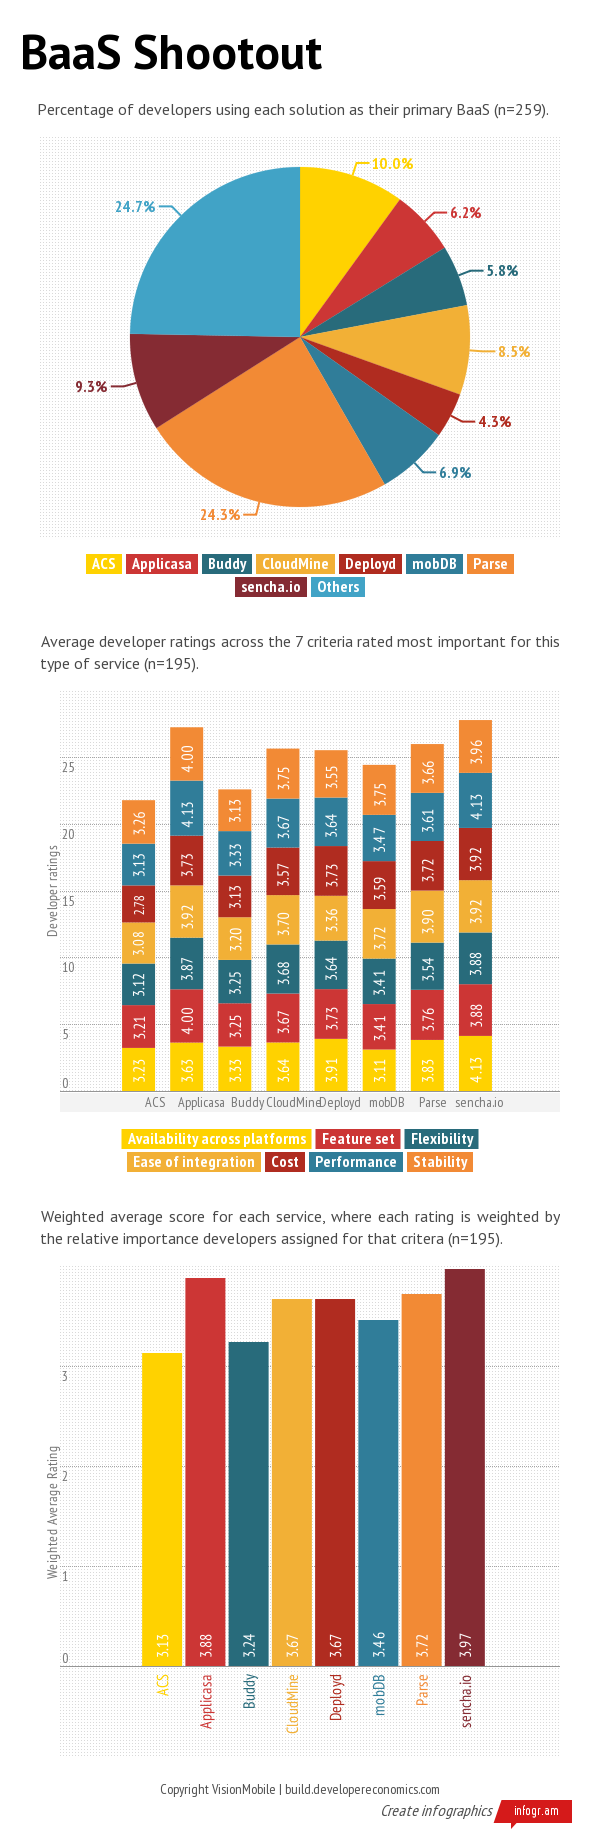
Some popular BaaS options tied to other tools

Parse was by far the most popular with almost 2.5 times as many responses as Appcelerator’s Cloud Service as the next most popular. Appcelerator’s service is fairly heavily tied to their popular Cross-platform tool (CPT) much like the Sencha offering, which had a very similar number of responses. However, while Sencha’s BaaS had the highest developer satisfaction in our survey, Appcelerator’s was the lowest of the top eight. This situation is the same as the satisfaction levels for the corresponding CPTs. While sencha.io may look attractive on developer ratings, adopting it implies using (at least some of) the Sencha libraries for cross-platform web development too – although this tool scored highly on cross-platform availability (the web works everywhere) there are no native SDKs.

Applicasa switched focus

Just behind sencha.io for developer satisfaction was Applicasa. However, while our survey was running Applicasa were in the middle of a mini-pivot from a generic BaaS to a “Mobile Game Management Platform”, having recognised that the generic BaaS sector was exceptionally crowded. They haven’t yet come out of beta or announced pricing, although this is likely to reflect their value-adding services for game developers. If you’re looking for a BaaS offering with extra functionality for mobile games then Applicasa may be worth a look.

Open source or specialised

Behind Applicasa comes Parse, closely followed by Deployd and CloudMine. Deployd does not yet have a production hosting solution, so it’s currently just an open source project that you host your own instance of on Heroku or Amazon. That’s also an advantage in that you can modify the code and you’ll always control your own data. Another open source BaaS option like this, Helios, was recently launched by Heroku themselves. If you can take on responsibility for some of the maintenance of the backend in order to maintain control of your backend code and data then this kind of open source option is very attractive. CloudMine on the other hand is focussing on larger corporate clients – they’re targeting enterprises and agencies producing lots of apps. Like Applicasa, they’re specialising to target what they see as a more profitable niche and trying to avoid mass market generic BaaS competition.

Further acquisitions likely – select with care

The remaining popular BaaS options in our survey scored below the average for “others” on developer satisfaction. However, just by looking at the top handful we can see some trends for the still immature sector emerging. The generic BaaS space is all about scale. The remaining vendors fighting for this market are likely to get acquired by a larger company, or run out of cash trying to compete. It was implied that there were multiple parties interested in acquiring Parse who are presumably still in the market for a similar solution. If the acquiror of your chosen BaaS is a PaaS vendor then the service should continue to evolve and developers’ data remain private. The large PaaS vendors are likely to build or buy a more complete BaaS solution – we already see this with Helios and Windows Azure Mobile Services. Other companies interested in buying a BaaS vendor might want to integrate with their own analytics (as with Flurry buying Trestle) or other developer services, secure a key supplier or just get a closer relationship with mobile developers. There may also be large enterprises that snap up a small BaaS vendor for their own internal use. Other BaaS vendors will specialise towards specific developer segments.

If, like most developers, you’re still experimenting in the market and not yet building your own services with a long term view then a BaaS that’s specialised to your app category might be a great option. For those looking to select a common backend architecture that they’ll re-use across multiple products, or platform to build on top of for the longer term, the open source frameworks look like the safest option in the current market.

Categories
Business Community Tips

Test Early, Test Often, Test on Everything?

Testing any mobile app presents a wide range of challenges. The often repeated but rarely followed software best practice of test early, test often is harder to adhere to than usual due to the fragmentation of the target environment and the relative maturity of tools. The increased acceptance of apps by mainstream consumers and intense competition have raised the bars for user experience and quality. There is more to test than ever, yet often very limited budget for doing so. Fortunately every challenge presents an opportunity and a vast array of tools vendors are racing to fill the gaps.

What to test?

Much of the traditional software testing literature focuses on various forms of functional testing – ensuring the system does what it’s meant to do. With a strong trend towards simpler, single purpose apps, this is often the easiest thing to verify in a mobile app project. There is now a much stronger focus on the user experience and this requires testing of an entirely different nature. The most effective way to test that an app is easy (or even fun) to use is to get feedback from real users. Doing that and finding major issues after the app has been built is a very expensive mistake to make, so most developers and designers will want to create mock-ups or prototypes for early feedback. There’s a wide range of tools to help with this task from simple wireframing through to full interactive prototyping. Given the importance of animations within mobile apps to enable users to discover interface interactions and learn to navigate, more complete prototypes are becoming increasingly desirable. As users become more sophisticated and specialist tools reduce the time and effort required to create interactive prototypes this trend is likely to continue.

With the majority of app store revenues coming through in-app purchases, another more specialized form of testing the design of an app is becoming increasingly important – split testing. On the desktop web, tools for trying out design and copy variants to optimize sites for specific user behaviours are very mature and the best of them can be used by staff with no development skills. In the mobile world most of the tools in this space are still very immature and developer-focussed. The responsive design trend on the web and the more restricted deployment options for native apps make this a more challenging problem for mobile devices but we expect the tools in this sector to mature rapidly.

[sectors slugs=’prototyping-mockup’]

When to test?

The earlier you find problems with software, the cheaper it is to fix them. As such, it makes sense to start testing as early as possible. How about testing the idea for the app via a mobile market research service before you even create your first wireframes? It’s worth considering – if you can’t generate interest in your app idea with a simple pitch it’s not going to be easy to get people to download it from the store either.

For most apps (particularly native apps) it’ll be worth using one of the mock-up or prototyping tools mentioned above and test the design before you start coding the real app. It’s much cheaper to iterate a simple design prototype than a native app. However, you’ll still want to try out the actual app with real users before you launch it. To help with that there’s a range of beta testing services that can help you distribute your beta app and find and/or manage testers. There are also services to help you get feedback from your users before and after the app launches. Providing a highly accessible feedback channel for users in the app is your best hope for preventing the inevitable disgruntled few from leaving bad reviews.

Ideally an app will be developed and tested iteratively with functional testing of new features and full regression tests for the existing functionality run for each iteration. This level of testing can get extremely expensive and time consuming unless it is automated. Fortunately there are several tools, open source frameworks and third party services that can help out there too.

[sectors slugs=’beta-testing,feedback-helpdesk,automated-app-testing’]

Where to test?

Another major problem for mobile developers is the scale and fragmentation of the market they’re trying to serve. Collecting a full library of test devices with major firmware variants is way beyond the budget of most developers, let alone the effort that would be required to test manually on all of them. Automated testing solutions can help here also and some services provide access to a large set of devices for remote testing too. However, it’s simply not feasible for most developers to test every version of their apps on all the device and firmware combinations they support. This limitation means some bugs are almost guaranteed to escape into the wild; the important thing then becomes how quickly you discover and fix them. For this reason, crash analytics and bug tracking tools are becoming increasingly important. Another useful weapon in this battle is your usage analytics data – it can enable you to focus testing on the devices which are most popular amongst your user base and also spot changes in use on particular device models that might signal a non-fatal error that’s causing users to abandon the app.

Finally, for some apps, where they are tested geographically may also be important. Do you know what the performance of your app is like for users who are far from your servers? If you use SMS, do you know how long it takes to get to users on different networks around the world (or if it even gets there). Have the localisations for your app been tested by native speakers? Our automated testing and app certification sectors include companies that can crowdsource beta testers or provide access software testing professionals almost anywhere in the world to help you scale globally without leaving your desk.

[sectors slugs=’crash-analytics-bug-tracking,user-analytics,automated-app-testing,app-certification’]

Categories
Business

Usage Analytics Shootout

Usage Analytics tools help developers understand their users and the way they interact with their apps. Measuring app usage in this way and using the data to help target improvements to the app can significantly improve revenues. We’ve already highlighted the duopoly in this tools sector, with Google and Flurry dominating. Our survey showed that 74% of developers made use of Google Analytics while 41% used Flurry. Clearly there’s some overlap here with developers using both and in fact less than 7.5% of developers who use this type of tool don’t use either Google or Flurry at all. However, lots of developers work on apps across multiple platforms for multiple clients and they may not always be able to use their first choice analytics tool. We asked developers to rate their primary analytics tool across a range of criteria. This data tells us which are developers’ first choice tools and how they compare.

Analytics Shootout


[box type=”alert”]The infogram service is currently experiencing some technical difficulties. We’ll bring back the interactive chart asap. In the meanwhile, you an find the filtered results mentioned in the article here.[/box]

Looking at all responses for developers primary tools Google and Flurry still dominate the market with Flurry slightly closer to Google and more than twice as popular as all of the other vendors combined. All of the tools show very high levels of developer satisfaction with Google slightly ahead overall. Outside of the top five selection criteria the only areas where other tools show significant advantages over Google or Flurry are custom views of the data and real-time analytics. If you have requirements on those areas it may be worth looking at the competition in more detail but for everyone else we can focus on the shootout between the top two.

Google beats Flurry in a head to head comparison

To try to get a more accurate comparison between Google & Flurry we filtered the data down to those developers who use both tools (and possibly others as well) such that they were in a position to make a direct comparison. This produces some interesting results; first, amongst developers that use both, Flurry is the primary tool for a majority of developers (53.1% vs 39.4%); second, on average, developers that use both tools rate Google higher on every single selection criteria, sometimes significantly so. The ratings gap between the two tools is magnified if we weight the criteria by the relative importance developers assigned in the survey. For the most important criteria, ease of integration, Flurry scores higher than Google when all responses are considered but the result is reversed when looking at only those who can make a direct comparison.

The future?

It seems Google has a slightly better tool but Flurry is still holding onto a majority of the developers that have tried both. The explanation for this slightly conflicting result appears to be that Flurry established itself as a leader in iOS analytics early and there is higher adoption of analytics amongst iOS developers in general. So, while Google’s analytics product may have the edge, it’s not sufficiently superior to justify switching for most existing users. Android ports or web apps may use Google analytics but the iOS app sticks with Flurry. This suggests that unless Flurry can improve their offering we may see their market share decline in future surveys as more developers adopt usage analytics. Given developer’s emphasis on ease of integration, the most likely disruption of the duopoly in this market would be an integrated offering – usage analytics combined with crash analytics and maybe also marketing analytics (install/referral tracking) in a single SDK.

Categories
Tools

Cross-Platform Tools Shootout

The “write once, run anywhere” concept may be pure fantasy for most apps but sharing code across platforms is desirable and in some cases essential to making projects economically viable. With the application frameworks for all the biggest platforms being in different languages, the market for Cross-Platform Tools (CPTs) to enable code reuse is understandably the largest one (in terms of number of competing solutions) we track. The time required to evaluate all of them is far beyond what most developers can afford to spend on such research. So, which tools are the best?

Balancing mindshare with developer ratings

In our last developer survey we asked CPT users to tell us what they considered most important when choosing a CPT and also to rate their primary tool (some developers use several) across multiple criteria. Because that report was primarily about tools, several of the CPT vendors promoted the survey to their developers. Although we try to weight responses resulting from different promotions to attempt to remove this sampling bias in our statistics, it’s not possible to eliminate it entirely from the relative popularity of the tools themselves. As such, although the developer mindshare is a useful indicator of quality tools, we shouldn’t trust that alone. Amongst the most popular tools, it turns out that CPT users are generally very happy with their choices.


The average score out of 5 for all of the tools with more than 30 sets of developer ratings is close to 4 and weighting that by the relative importance of each aspect increases the average for all of the tools except Qt.

Compare with care

[tweetable]It’s important to be careful when comparing scores for individual tools[/tweetable], since they may reflect the typical backgrounds and expectations of developers using them rather than some absolute rating. For example, Sencha scored 4.08 for “Native UI look and feel” despite having pure HTML5/JS/CSS components while Appcelerator only scored 3.86 here despite binding JavaScript logic to actual native components! Haxe (pronounced Hex) also shows a couple of issues like this. It’s a relatively unknown code translation tool which seems primarily targeted at former Flash developers, although by no means limited to that audience. Since the Haxe language can be compiled to most of the major programming languages it scores very highly on “Availability across platforms”. However, it’s important to note that unless developers want to build their own application framework from scratch or integrate with one in the target language manually they’ll also need NME, which does support a very wide range of platforms but not as many as some other CPTs. NME’s feature set is fairly gaming oriented, with access to further native APIs via native extensions, much the same as most of the other CPTs – there’s certainly not sufficient additional API coverage built-in to justify the increased score. Clearly it’s important to make a more thorough evaluation of tools before making a selection, even so, lots of satisfied developers can be a good indication of an interesting tool to evaluate.

And the winners are…

Using the weighted average score as our benchmark, overall Haxe came out as a clear winner in developer satisfaction. Second place went to Sencha, which seems to come out top on almost all metrics (except popularity) amongst general purpose web-centric CPTs. A very close third was RunRev’s LiveCode, which has recently gone open source with a dual-licensing model. None of these top 3 tools by developer satisfaction have more than 12% mindshare amongst CPT users, let alone the wider developer population. They all cover mobile and desktop platforms and between them cater to most tastes – there’s a strictly typed language (Haxe), web standards (Sencha) or a very high level dynamic language (RunRev). All of them are free to get started with, why not give one of them a try and find out why their users are so happy? After all, a happy developer is a productive developer.

Categories
Business

Does Cross-Promotion Work?

The concept of app developers banding together and promoting one another’s apps in order to increase awareness and download numbers for all concerned makes a lot of sense. Beyond developers promoting their own apps, or a couple of friendly developers getting together and agreeing a deal between themselves, it can get difficult to decide what’s fair with the wide variation in active user bases and engagement across apps. This suggests there’s a clear place for independent brokers to step in and create a market, which a large number have done. Some solutions offer direct trade in promotions between apps but most are simply app-specific advertising networks, charging developers to advertise and paying them for displaying ads. They key difference with pure ad networks is that ads are tracked right through to subsequent install (and sometimes app open) before any payment is made, rather than just a click on the ad.

When viewed as just another form of advertising, with a cost-per-action model, in theory this should work out fairly well for developers. User acquisition costs are predictable for advertisers and those displaying ads have reasonably good targeting built-in before any extra targeting logic used by the cross-promotion network – everyone viewing the ad has a smartphone and downloads apps on it! How does the theory work out in practice?

[sectors ids=’45’]

More users, more revenue

On average developers using cross-promotion networks (CPNs) have larger user bases and make more revenue than those not using such networks. Restricting our analysis to those developers interested in making money, able to report their revenue to us and earning less than $50k per app per month (the handful earning more than this will be discussed later): the average number of active users for the most popular app of those using CPNs was 181,800 vs. 76,600 for those not using CPNs. For the same groups, the average revenues were $3457 vs. $2487 per app per month respectively. As with most things related to the apps market, averages can be deceiving – 56% of developers using CPNs earn less than $500 per app per month. So while cross-promotion clearly works, the better question is who does it work for?

Higher CPI, more users & revenue

We asked developers using CPNs what their typical cost-per-install (CPI) was, without differentiating between usage of the networks as an advertiser, publisher of ads or both. Given this lack of differentiation it’s interesting to note that there’s a strong correlation between CPI and revenues, as shown in the graph below.

It’s also interesting to note that when you include the very highest earners, only $0 install costs and those above $1 are affected. Presumably very successful developers can and do effectively use some of these third party tools to cross-promote their own apps. Whilst it’s extremely likely that only those developers earning high ARPU (and thus almost certain higher than average revenues too) can afford to buy users at >$1.00 per install, it’s not at all obvious that those earning a higher CPI would be earning more revenue in total. Indeed with pure ad networks the reverse is almost true – high earners often have very low eCPM. This suggests two possible explanations, either there is a “high value” end of the market for cross-promotion where successful apps both advertise and publish ads, or only advertisers are making good money and the CPNs are taking a large cut.

High value customers, high value promotions?

Within our survey data there’s a clue that such a high value sub-market exists within cross-promotion networks. We asked developers about their reasons for selecting the networks they use; of all the reasons given, only two were correlated with significantly above average earnings for the sector. Both “Revenue share”, a publisher concern, and “Targeting options”, an advertiser feature, were correlated with more than 2.5 times the sector average revenue. A lot of the very low revenue apps using cross-promotion appear to be primarily targeting a low-income demographic (teenagers) who are unable to buy paid apps or in-app purchases directly and are therefore willing to earn them by either watching ads, downloading other apps or performing actions within them. It’s logical that these apps don’t generate a lot of revenue for publishers or advertisers. On the other hand, apps targeting more affluent users who do pay real cash for their app usage will be attractive cross-promotion partners for developers of other similar apps.

This really just comes down to basic business sense – if you want to make a decent amount of money, build things for people that have it to spend. It’s possible to make up for very low ARPUs with volume but it will require lots of apps and lots more work. Whichever route you decide to take it appears that cross-promotion is a viable monetisation option. If you’re aiming at low-ARPU users it may be that cross-promotion networks are your only advertising option but you’ll also need to find other marketing channels to get enough scale.

[doritos_report location=’DE13 Article – Does Cross-Promotion Work?’]

Categories
Tools

Capturing More Value with Voice Services

Of the tools and services for developers we asked about in our last survey, one category stands out by miles as having the wealthiest developers: voice services. If we exclude developers earning over $50k per app per month (as we typically do for other tools categories since a small number of successful developers can heavily distort the data) from those interested in money and reporting their income to us, then those using voice services earn an average of $4379 per app per month. This is a similar level of revenue to those using crash analytics services, which we’ve already shown is correlated with financial success. However, excluding those earning over $50k per app per month is rather unfair for voice services since this is almost 10% of developers using this tool category; if we include them, the average rises to $13410 (the comparable figure for those using crash analytics is $8764). Of course there’s a lot of variety in the voice services sector and the revenue is not at all evenly distributed.

Popular is not always profitable

In order of popularity, the most used services in our survey were Twilio, Skype, Mircrosoft & Tropo. Of those, the best in terms of revenues, Tropo, had 77% of developers above the “app poverty line” of $500 per app per month, whilst the worst, Microsoft, had 77% earning below that level of revenue. Outside of the top four services by popularity, there was a wide range of developer success but the average revenue was very close to the average for the whole category.

Skype is an extremely popular consumer service but their services for developers, particularly mobile developers, are quite limited in scope. SkypeKit, which is their offering for embedding Skype functionality in devices and other apps is not permitted to be used in mobile devices. Although Microsoft has similar capabilities to Twilio and Tropo through their acquisition of TellMe that is not yet fully integrated into their standard developer offering. If they try to use their capability to differentiate the developer offering for Windows Phone then it’s likely to remain limited by the success of their mobile platform.

Isn’t voice commoditised?

Whilst having voice services tied to a single platform is not ideal, cross-platform availability is not critical. Developers whose main reasons for selecting their service included cross-platform availability earned a below average for the sector but still very respectable $8120 per month. Those focused on call quality did slightly worse, while developers whose primary concern was cost did very poorly at only $2280 per month on average. At the top end of the spectrum, the only reasons correlated with revenues above $20k per month were feature set and scalability. The feature set breakdown in our survey makes it much clearer where the bulk of the money is being made by users of voice services. Fortunes are not being made by delivering generic VoIP services to giant user bases; in fact, the average number of active users for the most popular apps of developers across the whole voice services sector is only about 27,000. On the contrary developers using voice services for inbound calls averaged $25k per app per month, while those using intelligent call routing and/or Interactive Voice Response (IVR) systems averaged $30k per app per month. While it is possible that there are some developers doing good business using these cloud services to replace legacy IVR services or extend the reach of such services to smaller businesses, it’s very likely that many of these developers are building customer services channels for their own apps. In this case there’s some survivorship bias here – only fairly large and successful businesses would build out such complex customer services systems. Also it’s quite likely that businesses that need voice and SMS based customer service channels are about more than just an app, in which case the revenues associated with the apps may reflect sales of external goods, services or content and are thus not directly comparable with those of developers purely monetizing through paid downloads, advertising or in-app purchases (although all of these revenue models are used by some developers using these voice features).

Consider the costs

When you consider that numbers rented, call minutes and SMS’s sent all have associated costs from the voice services provider it’s not so surprising that a typical voice services developer has higher revenues – they need to in order to stay in business! The existence of these voice platforms is strong evidence that basic voice is commoditised and there’s very little room for differentiation or profit simply packaging and branding such services for consumers. So, while the revenues for all kinds of voice app are higher than average, the associated costs are higher too. Those developers that capture significant value with voice services are using them to add value to some other service, rather than trying to re-sell them directly. That said, these services are very easy to use and relatively inexpensive. It’s worth thinking about ways you could use them to build better relationships with the customers for your app business.

Categories
Business

Backend-as-a-Service Economics

There are a wide variety of products that can be considered Backend-as-a-Service (BaaS) offerings. At the time of writing we list 43 of them on our sector summary page. We have previously discussed whether or not they’re a good idea and how much development effort you could save by using one. In our most recent survey we asked developers about their use of some of the most popular options. By comparing developers’ use of BaaS with their average revenues and active user bases, we can determine how well these products are working for them.

BaaS, what’s BaaS?

An interesting point to note is that a lot of developers don’t appear to know what BaaS really is yet, suggesting there’s plenty of room for growth in this sector. Almost 20% of the developers in our survey who indicated they use BaaS solutions said they were using their own proprietary backend; this is just a backend service and not BaaS, since it is built in-house rather than re-using a more generic backend solution from a third party. We exclude all of these people from this analysis. Technically it’s only really BaaS if the provider hosts it for you too, although we include options like Deployd, which is an open source project that combines with a PaaS offering like Heroku to give all the features of a BaaS (and more flexibility).

[sectors slugs=’backend-as-a-service’]

Show me the money!

Developers using BaaS solutions have an above average interest in making money. Only 11% of BaaS users were not interested in money vs. 20% of non-users. This is probably because the costs of running any kind of backend service are a deterrent to hobbyists. Of the remaining developers who are interested in making money (excluding those who were unable to report their revenues, or earned over $50k per app per month) 43% of BaaS users were earning more than $500 per app per month vs. 31% of those not using BaaS. The average monthly revenue for BaaS users was $3223 vs. $2482 for non-users. So, developers are more likely to earn enough to cover the costs of running a backend if they use a BaaS and also earn more than enough extra revenue to pay for hosting/service costs on average.

More backend features = more revenue

Not all BaaS solutions have the same feature set. The more comprehensive offerings typically have user, content and data management, along with push notifications, social integration and some kind of location data support built-in; most are also able to be extended with custom code. Less complete solutions generally only offer a small subset of this feature set, with different vendors providing different subsets. Some services are well integrated with cross-platform tools (e.g. Appcelerator Cloud Services and Sencha.io) and although they are quite comprehensive, their results appear to be more influenced by the CPT itself than the use of the BaaS – that said, users of these services also make more revenue than other users of the CPT, with Sencha coming out significantly ahead of Appcelerator in both cases. Finally, Deployd and Apigee Usergrid offer more flexible/configurable options, where users can add features from a fairly comprehensive base.


As can be seen from the graph above, users of the more comprehensive BaaS offerings make significantly more revenue than other BaaS users. On average their active user bases are only about 20% larger, so it seems the more feature rich backend services are translating to higher value generated for end users.

Which features are most important

We also asked developers which features were most important to them when selecting a BaaS. The majority of users were interested in user management and data management, features available in almost all BaaS offering and thus unsurprisingly correlated with approximately average revenues. Those primarily interested in using a BaaS for push notifications or file storage had almost half the average revenues (these are fairly easy to achieve without the overheads of a BaaS, possibly indicating a lack of sophistication) while those interested in content management made about 50% more than average and those most interested in analytics more than double the average. This outperformance for developers focussed on server side analytics mirrors that on the client side, suggesting it’s the developers’ approach and not the feature itself with produces the improved results.

Categories
Business Tips

How to Optimise Ad Revenue

On the surface, advertising seems like a fairly simple and easy to implement business model for an app. Decide on some places to display ads, integrate one or more third party ad services and wait for the money to start rolling in. If you do this without a clear plan for how and why users will interact with ads in your app you’ll probably find the revenue disappointing. Optimise revenue by growing your user base, increasing engagement and improving your fill rate (how many of your possible ad slots actually show an ad) and eCPM (effective cost per thousand impressions). The challenge becomes apparent when you try to improve these metrics and find them somewhat opposed to one another. Show too many ads and users either use your app less or abandon it altogether. Make the ads smaller or display them less prominently and your click-through ratio (and hence eCPM) goes down. Show a lot of irrelevant ads (higher fill rate typically has less relevance on average) prominently and users start ignoring all of them by default. Make your ads prominent and they’d better be relevant. If it’s hard to target your audience well then keep the advertising low key and count on volume to make up the revenue. It turns out that getting the right balance is very difficult and not many developers manage it.

Higher eCPM != higher revenue

A very small fraction of developers in our survey managed to achieve truly exceptional eCPM’s, greater than $5, sometimes even more than $10. These developers were almost all making multiples of the average revenue in total but they were also using more than one revenue model. It’s likely that most of their revenue was coming from another source and they showed very few highly relevant ads to get those rates. If we focus on the developers who only used advertising as a revenue model then those with eCPM’s below $0.25 were earning significantly more on average than those with eCPM’s from $0.25-1.50. So, for the majority of developers, those with higher eCPM’s make less money. To add to the confusion, size of active user base is also very weakly correlated with ad revenue; the simple concept of getting more users to make more money from ads doesn’t work on its own either.

Why iOS developers make more with ads

A good illustration of the complexity is to compare iOS and Android developers. As reported by several ad networks, iOS gets a higher eCPM on average than Android. However, our survey data suggests that the difference is all at the very high end. If we exclude the developers with eCPMs over $5, iOS actually has a lower eCPM than Android. For those only monetizing via ads, Android developers had a 37% higher eCPM and while the iOS developers only had 20% larger user bases on average, they earned almost 75% more revenue every month. This suggests that the iOS developers were seeing very much higher engagement with their apps and thus delivering many more ad impressions.

The fallback network fallacy?

There’s some popular advice that in order to maximise ad revenue, developers should use at least two ad networks, one with a high eCPM and low fill rate and another with a lower eCPM but very high fill rate. The theory is that this ensures they get the most relevant targeted ads with the best rates when they’re available but still don’t waste the inventory by filling it with less relevant lower paying ads when they don’t get filled by the premium network. This fallback strategy sounds logical but does it work? There’s some possible support for this in the fact that developers using more than one ad network make slightly more money on average than those who only use one (and 70% of developers purely monetizing through ads only use one network). However, this seems more likely to indicate greater sophistication than successful use of the fallback strategy. The ads from the two different networks are unlikely to fit the same presentation, positioning and format within an app well. There’s some fairly strong evidence against this fallback strategy within our survey data – developers with eCPMs above $5 are excluded from the following sample and so are those earning greater than $50k per app per month in revenue due to the disproportionate effect both tiny minorities have on averages.

Note that 67% of developers using ads selected neither eCPM nor fill rate as reasons for choosing their ad networks and that percentage is mirrored in the group only using ads for monetization. Those that selected one criteria or the other but not both generated slightly higher eCPM than average and significantly higher revenues. Developers trying to maximize both metrics to squeeze the maximum possible revenue out of the advertising space in their apps generated the highest eCPM but did far worse than average on revenues.

Optimise for engagement

This data suggests that developers should pick an appropriate advertising style for their app and try to go for either quality or volume of ads displayed but not both. Considering that the most popular advertising services use a cost-per-click model, the highest eCPMs are likely to simply reflect higher click-through ratios. In many cases the taps on ads may be accidental. Ads getting in the way of the content or usage of an app result in fewer users or lower usage and thus lower revenue. It seems that by far the best way to optimise ad revenue is to build app experiences that people want to spend a lot of time using and make sure the ads don’t spoil them. The extra volume of impressions generated by tens or hundreds of thousands of engaged users will more than make up for lower eCPMs or ad inventory not getting filled.

Categories
Business

Why Measurement Matters – the case for analytics

Creating a successful app business takes a lot more than a good idea and the skills to develop an app and upload it to a store. As we’ve discussed before, developers who promote their apps are almost 3 times as likely to break-even as those who don’t. This is the simplest difference with a massive effect on success. It seems obvious, no marketing means a good chance almost no-one discovers the app and thus no revenue, yet some developers still don’t do it. Picking the most lucrative platforms seems like another obvious candidate; considering only those developers who are interested in making money, those that develop for iOS are a little less than twice as likely to be above the “app poverty line” (38% earn over $500 per app per month) than those developing for BlackBerry (20%). Getting your revenue model right can also make a significant difference; according to our survey, developers using a subscription model earn nearly 2.5 times as much as those using other revenue models on average. Not all apps can use a subscription model, however, there is something that almost every developer can do which is correlated with more than double the chance of being above the app poverty line and earning more than 2.5 times the average revenue compared to those that don’t…

Measuring user activity and crashes

You managed to build an app and get people to download it but how many of them still use it? When do they use it and how often? What devices do they have and which firmware versions? What features do they use the most? Which parts of the app should you focus on improving? Do your changes to the app make users interact with it more or less? All of these questions require measuring the user interaction with the app by recording data and analysing it. Unless your app regularly interacts with your own backend service which you can collect relevant statistics from then this would be an expensive capability to build. Fortunately there are a number of third party usage analytics services to do it for you and the two most popular, Google Analytics and Flurry, are free to use.

Similarly, no app is perfect when it is launched and it’s almost impossible to test on every device and firmware combination out there in the market. If some of your users are getting crashes that you can’t reproduce and fix quickly then you’re likely to get a lot of poor reviews, which will reduce the chances that other users download your app in the future. Unless you have tooling in place to capture details of crashes and report them to you then it’s very hard fix them. Although there are libraries that can report crashes to you directly, unless you want to analyse every single one manually, you’ll want tools that do that for you and categorise them such that the ones with common causes are grouped. Without this there’s no good way of prioritising what to fix. Again, crash analytics & bug tracking service providers can handle this for you and one of them, Crashlytics, was recently acquired by Twitter and now provides all of its features for free. Other providers also have free tiers.

This is not to suggest that the free options are the best for every app, just that there’s very little excuse for not using these tools because there are free ones. If you need convincing, take a look at this infographic, which uses our survey data for just the respondents that were interested in making money and earning less than $50k per app per month (we exclude the very small number of top earners as they can distort the stats, although in this case they would only make the argument stronger).

Correlation is not causation

It’s really important that we note a strong correlation between usage of analytics tools and increased success for developers only. Correlation is not causation. It’s clear that simply integrating these tools and doing nothing with the data is not going to make the slightest difference to anyone’s results. They are trivial to integrate but provide no direct end user benefit at all and no additional revenue stream. It could be argued that most providers only make these services available for the leading platforms and the extra success is primarily due to that. This is not the case – restricting the data set to those developers whose primary platform is Android or iOS produces an almost identical pattern of results. Another argument is that crash analytics services are typically focussed on native stack traces, which don’t often provide much diagnostic value for non-native apps. However, anyone tempted to blame a poorer non-native user experience produced by development tools that are also less likely to support these analytics tools should note that cross-platform tool users make more revenue.

One valid argument is that until you have a successful app with a fairly large and diverse user base, collecting crash data and analysing it is not the biggest problem you need to solve, those who use the services may simply be the ones already big enough to have the problem. There are two arguments against this. First, integrating crash analytics after you’ve acquired a large user base is too late; how many users will give you a second chance installing at least 2 updates to a crashy app (you can’t fix it until the update after you integrate the analytics)? Second, this doesn’t explain why those integrating both types of analytics tool have a significantly greater chance of being above the poverty line than those that only integrate one or the other. Similarly, whilst there is almost certainly an experience factor at work here it is clearly not the whole answer.

The most plausible explanation for these results is that those with a more scientific approach to their app business tend to collect as much data as they can and use it to drive decisions about their development. This produces more successful apps than intuition and guesswork. So, sign up for analytics services, integrate them with your apps and act on the data they provide. This process can’t magically turn a bad idea or unwanted app into a success but it can help make a decent app into a much better one. If you apply some of this data-based reasoning and scientific methodology to deciding what to build and how you market it too then that’s likely to further increase your chances of success.

Got an alternative explanation for this data? Let us know in the comments below.

Categories
Platforms Tips

A/B Testing on the Amazon Appstore

In December Amazon launched a new A/B testing service for Android apps on the Amazon Appstore. Integrating A/B testing, particularly for in-app purchase related events, in the store portal is a welcome addition. Slightly disappointing considering this comes from a store provider is that the A/B testing service does not support testing different copy or icons on the storefront itself, purely in-app A/B tests, for which there are already third-party alternatives.

Not a “leaner” alternative store

When we looked at the developer platform “lean factor” for Android previously, we were only considering Google Play. Android came out on top due to the ability to publish new versions to the store almost immediately, enabling much faster iteration. However, the Amazon Appstore does have a review process which introduces significant publishing delay. As such even with the convenient addition of A/B testing baked into Amazon’s store, Google Play still offers a better environment for implementing lean development.

Testing in a smaller market

That said, there is at least one interesting use of this new service. Amazon’s Appstore has historically had a much higher proportion of users paying for downloads and in-app purchases than on Google Play – so much so that in early 2012 many developers made more money on Amazon’s store despite the much smaller audience. A smaller market with a high proportion of paying users is ideal for A/B testing improvements with the most important user group, particularly improvements to in-app purchase flows. Testing new variations on Amazon’s store and then rolling the successful ones out to a Google Play version might be a useful strategy for increasing revenues.

But how much smaller?

A final question is how much smaller is Amazon’s store in terms of downloads? They are notoriously silent when it comes to absolute numbers and even the relative numbers they give are ambiguous. In the press release for the A/B testing service linked above they say that app downloads have grown 500% over the previous year. This was in a release at the beginning of December with no fixed reference point given for the comparison. As can be seen from the relative growth chart produced by Distimo at the same time last year below, the launch of the original Kindle Fire at that time produced similarly massive growth.
Distimo_Amazon_AppStore
Dependending on where the comparison is made, a 500% increase could be anywhere from slightly behind January’s download level to 6 times the December 2011 peak. Until they provide some concrete numbers the best advice is to try it and see what your own results are like. The only major difference we’re certain of between the app buying users on the two stores is a higher proportion of tablet users at Amazon’s.