Categories
Tools

Advertising is the most popular developer service, AdMob dominates (65%)

Advertising is the most popular developer service

Among those developer services that we benchmarked the most popular is ad networks and exchanges, reflecting the widespread popularity of advertising as a revenue model. Advertising is the most popular revenue model, while ads can also act as a promotion channel that facilitates app discovery.

With advertising being the most widely used revenue model among developers, advertising services attract considerable developer interest taking the top spot among the developer tools that we benchmarked. Providers of ad services monetise their service by taking a direct cut of advertising revenue generated by developers. With 100+ ad networks and exchanges, there is intense competition, regional specialisation and niche solutions. In spite of this, several ad services are not profitable.

The services we benchmarked are either advertising networks that provide direct access to their own pool of ads or ad exchanges (aka mediation engines, not real-time bidding exchanges) that act as aggregators, automating access to a large number of individual ad networks. Ad exchanges offer some flexibility to developers by allowing them to select between multiple ad networks through a single SDK – offering better fill rates and eCPMs. At the same time, ad network SDKs often provide access to more features available, than the generic features available through an ad exchange.

Ad services are most popular with Windows Phone and Android developers

Among developers using Ad services, 27% use an exchange, however, just 16% utilise an ad exchange as their primary ad platform. Most developers using ad services use just one service (61%), 25% use two services and 14% use three or more services. Overall, developers use 1.59 services on average. There is quite a large variance in the number of developers using ad services depending on the scale of development: those developing less than 5 apps per year tend to use ad-services much less than those developing more than 5 apps per year. Among developers that develop more than 16 apps per year, most likely working for large publishing houses, software services companies or agencies, about 60% use ad services in their apps.

Ad services are most popular with those who develop primarily on Windows Phone and Android (46% of WP developers and 43% of Android developers), and less so on iOS and BlackBerry (35% and 31% respectively). This is in agreement with our findings on revenue models being used on each platform, with developers on Android and Windows Phone relying heavily on advertising to monetize their apps.

DE13-16-01

AdMob dominates ad networks (65%) and Inneractive leads among ad exchanges (12%)

AdMob, a service acquired by Google in 2010 is clearly the dominant platform in mobile ad services, adopted by 65% of developers that use ad services. AdMob has recently expanded to ad exchange services, a move that aims to counter the threat that ad exchanges pose for Google. Second runners, each used by 12% of developers, are Inneractive, an ad-exchange/mediation service and InMobi, an ad network growing out of India to become a major player in emerging markets: InMobi’s mindshare is 17% in Asia and 33% in Africa. Apple’s iAd service comes fourth overall with 11%, and despite being quite popular among iOS developers, AdMob is the leading ad service on iOS, used by 66% of iOS developers that we surveyed.

Ad exchanges are complementary to ad networks. For example, developers will use one service with high eCPM but low fill rate and another with lower eCPM but nearly 100% fill to plug the gaps in the better paying service. When selecting an ad network or exchange, availability across platforms comes on top in both cases. Ease of integration is also very important, particularly so for developers using ad networks. Supported ad formats, revenue potential and fill rate are secondary selection criteria, and therefore differentiation factors across advertising services.

[toggle title=”Important things to know about this interactive graph”]

  • All the filters in the graph refer to survey questions in which respondents could select multiple answers. This means that there is no direct link between the filter and the use of the tool. For example, filtering on “Android” means that the respondents develop Android apps. It doesn’t imply that they use the tools for their Android apps specifically, or even that the tool supports the Android platform. Use filters as a guideline only.
  • Keep an eye on the sample size. If the sample size is low, the graph doesn’t offer strong conclusions about the popularity of different tools. Use your good judgment when making decisions.[/toggle]

    Find the best ad service for you!

    [sectors slugs=’ad-networks-exchanges’]

Categories
Business

Does Cross-Promotion Work?

The concept of app developers banding together and promoting one another’s apps in order to increase awareness and download numbers for all concerned makes a lot of sense. Beyond developers promoting their own apps, or a couple of friendly developers getting together and agreeing a deal between themselves, it can get difficult to decide what’s fair with the wide variation in active user bases and engagement across apps. This suggests there’s a clear place for independent brokers to step in and create a market, which a large number have done. Some solutions offer direct trade in promotions between apps but most are simply app-specific advertising networks, charging developers to advertise and paying them for displaying ads. They key difference with pure ad networks is that ads are tracked right through to subsequent install (and sometimes app open) before any payment is made, rather than just a click on the ad.

When viewed as just another form of advertising, with a cost-per-action model, in theory this should work out fairly well for developers. User acquisition costs are predictable for advertisers and those displaying ads have reasonably good targeting built-in before any extra targeting logic used by the cross-promotion network – everyone viewing the ad has a smartphone and downloads apps on it! How does the theory work out in practice?

[sectors ids=’45’]

More users, more revenue

On average developers using cross-promotion networks (CPNs) have larger user bases and make more revenue than those not using such networks. Restricting our analysis to those developers interested in making money, able to report their revenue to us and earning less than $50k per app per month (the handful earning more than this will be discussed later): the average number of active users for the most popular app of those using CPNs was 181,800 vs. 76,600 for those not using CPNs. For the same groups, the average revenues were $3457 vs. $2487 per app per month respectively. As with most things related to the apps market, averages can be deceiving – 56% of developers using CPNs earn less than $500 per app per month. So while cross-promotion clearly works, the better question is who does it work for?

Higher CPI, more users & revenue

We asked developers using CPNs what their typical cost-per-install (CPI) was, without differentiating between usage of the networks as an advertiser, publisher of ads or both. Given this lack of differentiation it’s interesting to note that there’s a strong correlation between CPI and revenues, as shown in the graph below.

It’s also interesting to note that when you include the very highest earners, only $0 install costs and those above $1 are affected. Presumably very successful developers can and do effectively use some of these third party tools to cross-promote their own apps. Whilst it’s extremely likely that only those developers earning high ARPU (and thus almost certain higher than average revenues too) can afford to buy users at >$1.00 per install, it’s not at all obvious that those earning a higher CPI would be earning more revenue in total. Indeed with pure ad networks the reverse is almost true – high earners often have very low eCPM. This suggests two possible explanations, either there is a “high value” end of the market for cross-promotion where successful apps both advertise and publish ads, or only advertisers are making good money and the CPNs are taking a large cut.

High value customers, high value promotions?

Within our survey data there’s a clue that such a high value sub-market exists within cross-promotion networks. We asked developers about their reasons for selecting the networks they use; of all the reasons given, only two were correlated with significantly above average earnings for the sector. Both “Revenue share”, a publisher concern, and “Targeting options”, an advertiser feature, were correlated with more than 2.5 times the sector average revenue. A lot of the very low revenue apps using cross-promotion appear to be primarily targeting a low-income demographic (teenagers) who are unable to buy paid apps or in-app purchases directly and are therefore willing to earn them by either watching ads, downloading other apps or performing actions within them. It’s logical that these apps don’t generate a lot of revenue for publishers or advertisers. On the other hand, apps targeting more affluent users who do pay real cash for their app usage will be attractive cross-promotion partners for developers of other similar apps.

This really just comes down to basic business sense – if you want to make a decent amount of money, build things for people that have it to spend. It’s possible to make up for very low ARPUs with volume but it will require lots of apps and lots more work. Whichever route you decide to take it appears that cross-promotion is a viable monetisation option. If you’re aiming at low-ARPU users it may be that cross-promotion networks are your only advertising option but you’ll also need to find other marketing channels to get enough scale.

[doritos_report location=’DE13 Article – Does Cross-Promotion Work?’]

Categories
APIs Tools

Which apps make more money? App monetization insight from our Developer Economics 2013 report

[This post by Andreas Pappas, Senior Analyst at VisionMobile, first appeared on the VisionMobile blog on April 3, 2013.]

[How do app developer revenues vary by country, or platform? Does the number of platforms make a difference to app revenues? Which models bring in the most revenues? We revisit Andreas Pappas’ November analysis of app monetisation with more insights from our Developer Economics 2013 survey across 3,400+ developers – while launching our latest survey, which is available here]

Developer-Economics-volume-5

Back in November, we looked at which apps make money based on research on how app revenues vary by platform, app category, country and more. In this article we update our analysis on app monetisation based on the latest research from Developer Economics 2013 across 3,400+ app developers, including analysis that did not make it into the report.

We ‘re also proud to launch our very latest Developer Economics survey, which reaches across thousands of app developers and provides the data for our famous state of the developer nation reports. Thanks to the sponsorship by BlackBerry, Mozilla, Intel and Telefonica it possible to provide these reports and additional insights, for free, to the entire mobile community.

Take part in the survey, spread the word and help us drill deeper into the app economy and what makes it tick. We have prizes aplenty for developers, with 7 devices up for grabs (one iPhone 5, two Samsung Galaxy SIII, two Nokia Lumia 920 devices and two BlackBerry Dev Alpha handsets) – plus an AR Drone 2.0, a Nest Learning Thermostat and a Nike Fuel Band for participants who also subscribe to our developer panel. Last, but definitely not least, our friends at Bugsense are giving away one month of free crash reporting to each and every participant.

Survey Q1 2013


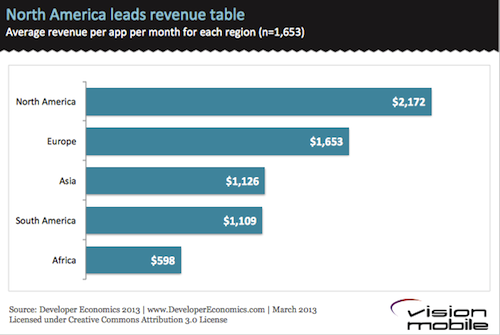
Developers in North America lead the revenue leaderboard

We’ll start by taking a look at income distribution by the region where app developers are based. Last time we saw that US developers earned almost double the revenue of UK developers. Based on our Developer Economics 2013 data, North America (and particularly the US) is still in the driving seat of the mobile app economy with developers in North America generating about 30% more than their european counterparts, who in turn generate 47% more revenue than developers in Asia. To some extent higher revenues for NA developers are explained by higher consumer spending in the US and higher penetration of iOS, which as we will see later on, still generates higher revenues than other mobile platforms. Note that across this analysis we are restricting our sample to mobile app developers, and have excluded the top 5% of revenue earners in order to minimise the effect of outliers.

North America leads app revenue leaderboard

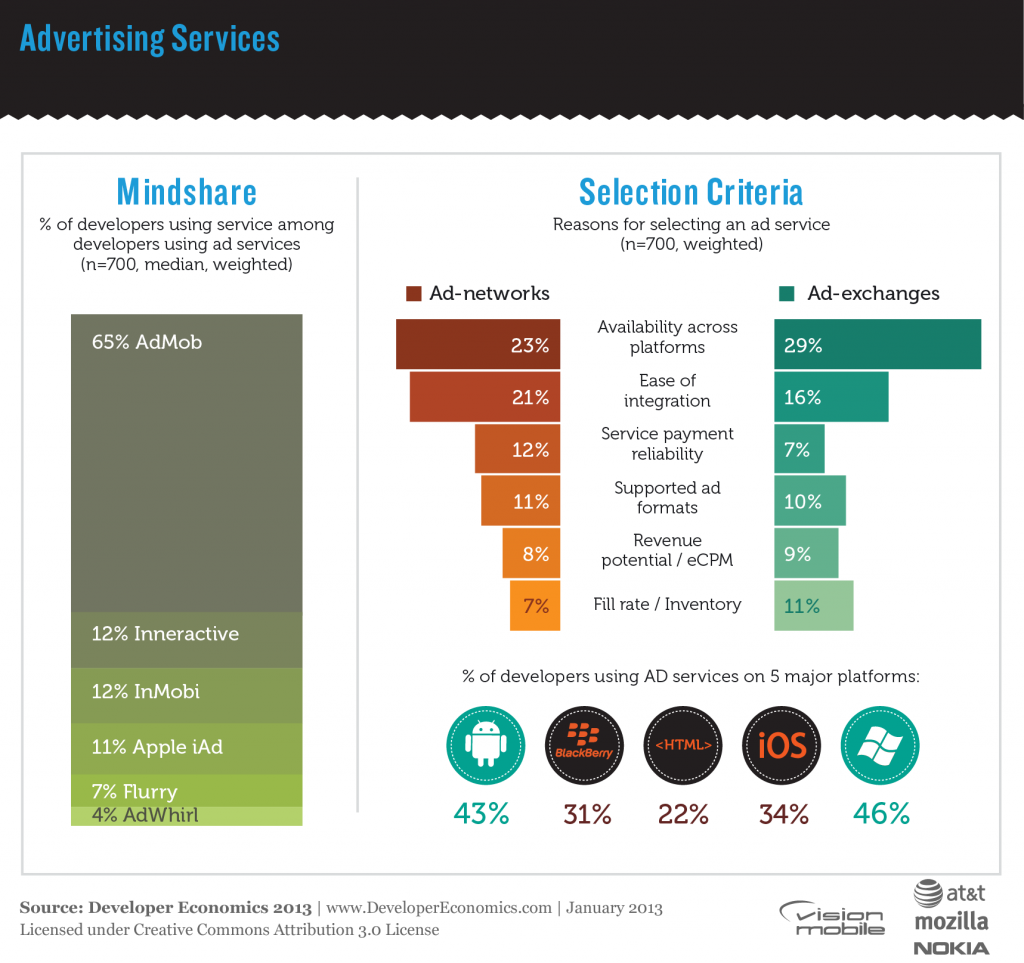
While app development activity is booming in Asia, the average app-month revenue is quite lower than in the US and Europe, although developers in Asia develop, on average more apps and use more mobile platforms. As we explained in the previous article, there are multiple reasons for this revenue gap, but the prevailing reason is the fact that paid apps are not popular in most of Asia, the country that drives the Asian app economy. Instead, developers in Asia rely much more on advertising revenue, which, according to our findings is the least profitable revenue model.

iOS still monetising better than other platforms

iOS continues to dominate platform revenues, generating, on average, 30% more revenue per app-month than Android. The revenue gap has reduced by 5 percentage points compared to that reported in our Developer Economics 2012 report in June 2012.

iOS continues to dominate revenues

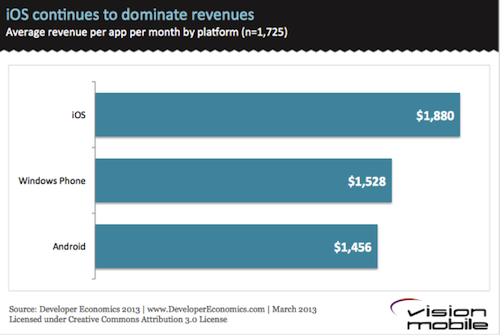
At the same time, Windows Phone has caught up with Android and seems to be doing slightly better. Although the 5% advantage is arguably within the margin of error, Windows Phone has significantly improved its position relative to the figures reported in the Developer Economics 2012 survey, when it generated, on average, about half as much revenue as Android. How has the landscape of platform monetisation changed in Q2 2013? Join the survey and help us track the state of the developer nation.

Multi-platform developers earn more

Developers using more platforms earn more

There is a wide revenue gap between developers/publishers using 6+ platforms and those using 5 or fewer platforms, with those developing for 6+ platforms generating, on average, 75% more revenue. However, only a small part of the developer population (4%) develops on 6+ mobile platforms; these are probably established services with a large footprint that want to ensure that their apps are universally available (e.g. Facebook, Skype etc.) or large software houses with a large enough pool of resources to target multiple platforms for their customers.

Those developers employing just one platform are probably solo, amateur developers or have not yet had the success that warrants (and allows) an expansion onto more platforms. As developers become more successful, they will expand onto new platforms and generate more revenue. So while, expanding on more platforms is not sufficient to generate more revenue on its own, those that do find success are likely to invest in a multi-platform strategy.

Extending apps to new markets is a profitable strategy

We asked app developers how they decided on which apps to develop or work on next and then looked at the way revenues vary depending on their strategy. While most developers will develop apps they want to use themselves (50%), this is apparently the least successful strategy and should not become the sole deciding factor for your next app.

Extending apps into new markets pays better

Developers that use some form of market research such as discussing with users, monitoring apps stores or directly buying market research are much better off, generating at least double the revenue of those who just develop the apps they want to use. However, market research is not widely used among the developer population: only 24% of developers discusses with users, highlighting a lack of business maturity and also a gap in frictionless 2-way communication channel between developers and users.

Overall, the most successful developers are those that extend apps to new markets, either to new geographies or different verticals. To some extent, these strategies rely on copying the recipe of an already established and successful business: these are apps that have been tried and proven in at least one market and are generally less risky options or “low hanging fruit” for developers. Why start from the ground up when you can stand on the shoulders of giants?

The most lucrative revenue models are off limits for most developers

When talking app monetisation, there are over 10 different revenue models to chose from. Device royalties and distribution licensing fees are the top-grossing models but are quite rare among app developers due to their high barriers to entry. These models imply deals with device manufacturers and distributors which means long, expensive sales cycles and a successful app to start with. Among the rest of the revenue models, commissioned apps (development for hire) come on top since they come with a low risk and guaranteed income for developers that work under contract.

Royalties & licencing fees pay better

The next most lucrative revenue model is the subscription-based model but this also comes with caveats: a subscription service implies a significant investment in licensing, and maintaining quality content or services that keeps users engaged on an ongoing basis.

Among the revenue models that are most popular and more accessible to developers, In-app purchases come on top, generating, on average 34% more revenue than Freemium and 43% more revenue than Pay-per-download. In-app purchases and Freemium models are becoming increasingly popular, now being used by a quarter of developers as they seem to be appealing to consumers. We ‘re revisiting the topic of most lucrative revenue models in our latest survey. Join in and help us size the app economy.

Smart developers use smart tools

Finally, we take a look at how developer revenues correlate to the use of third party tools and services. It’s interesting to see how app revenues correlate with usage of performance tracking and management tools like user analytics and crash reporting. Developers using crash reporting and bug-tracking tools such as Crittercism or BugSense generate on average, three times more revenue than developers who don’t use these. Similarly the usage of User Analytics (e.g. Flurry, Apsalar) services is also associated with much higher revenues, with those using user analytics services generating 168% more revenue than those who don’t.

Higher revenues for developers using dev tools

Both user analytics and crash reporting services are used by experienced developers who recognise the importance of optimising for user acquisition, activation and retention, while reducing in-the-field crashes and the resulting user churn.

Track the state of the developer nation

[tweet_this content=’App developer? Take the new Developer Economics survey and win prizes!’ url=’ http://www.visionmobile.com/DS13PortalBlog’]These insights are made possible by our ongoing surveys. Join the latest Developer Economics survey to help us draw deeper insights into monetisation, the size of the app economy and the debate of HTML5 vs. native. In this survey we ‘re focusing on the population of iOS, Android, WP, BlackBerry and HTML5 developers, across countries, app categories and developer types. If your are a developer take the survey, or otherwise spread the word and watch this space for an update on revenues, platforms and the state of the developer nation.[/tweet_this]

And don’t forget to fire away with those comments, rants, criticism, praise or simply feedback on what you ‘d like to see next.

Andreas (follow me on twitter @PappasAndreas)

Categories
Tools

Capturing More Value with Voice Services

Of the tools and services for developers we asked about in our last survey, one category stands out by miles as having the wealthiest developers: voice services. If we exclude developers earning over $50k per app per month (as we typically do for other tools categories since a small number of successful developers can heavily distort the data) from those interested in money and reporting their income to us, then those using voice services earn an average of $4379 per app per month. This is a similar level of revenue to those using crash analytics services, which we’ve already shown is correlated with financial success. However, excluding those earning over $50k per app per month is rather unfair for voice services since this is almost 10% of developers using this tool category; if we include them, the average rises to $13410 (the comparable figure for those using crash analytics is $8764). Of course there’s a lot of variety in the voice services sector and the revenue is not at all evenly distributed.

Popular is not always profitable

In order of popularity, the most used services in our survey were Twilio, Skype, Mircrosoft & Tropo. Of those, the best in terms of revenues, Tropo, had 77% of developers above the “app poverty line” of $500 per app per month, whilst the worst, Microsoft, had 77% earning below that level of revenue. Outside of the top four services by popularity, there was a wide range of developer success but the average revenue was very close to the average for the whole category.

Skype is an extremely popular consumer service but their services for developers, particularly mobile developers, are quite limited in scope. SkypeKit, which is their offering for embedding Skype functionality in devices and other apps is not permitted to be used in mobile devices. Although Microsoft has similar capabilities to Twilio and Tropo through their acquisition of TellMe that is not yet fully integrated into their standard developer offering. If they try to use their capability to differentiate the developer offering for Windows Phone then it’s likely to remain limited by the success of their mobile platform.

Isn’t voice commoditised?

Whilst having voice services tied to a single platform is not ideal, cross-platform availability is not critical. Developers whose main reasons for selecting their service included cross-platform availability earned a below average for the sector but still very respectable $8120 per month. Those focused on call quality did slightly worse, while developers whose primary concern was cost did very poorly at only $2280 per month on average. At the top end of the spectrum, the only reasons correlated with revenues above $20k per month were feature set and scalability. The feature set breakdown in our survey makes it much clearer where the bulk of the money is being made by users of voice services. Fortunes are not being made by delivering generic VoIP services to giant user bases; in fact, the average number of active users for the most popular apps of developers across the whole voice services sector is only about 27,000. On the contrary developers using voice services for inbound calls averaged $25k per app per month, while those using intelligent call routing and/or Interactive Voice Response (IVR) systems averaged $30k per app per month. While it is possible that there are some developers doing good business using these cloud services to replace legacy IVR services or extend the reach of such services to smaller businesses, it’s very likely that many of these developers are building customer services channels for their own apps. In this case there’s some survivorship bias here – only fairly large and successful businesses would build out such complex customer services systems. Also it’s quite likely that businesses that need voice and SMS based customer service channels are about more than just an app, in which case the revenues associated with the apps may reflect sales of external goods, services or content and are thus not directly comparable with those of developers purely monetizing through paid downloads, advertising or in-app purchases (although all of these revenue models are used by some developers using these voice features).

Consider the costs

When you consider that numbers rented, call minutes and SMS’s sent all have associated costs from the voice services provider it’s not so surprising that a typical voice services developer has higher revenues – they need to in order to stay in business! The existence of these voice platforms is strong evidence that basic voice is commoditised and there’s very little room for differentiation or profit simply packaging and branding such services for consumers. So, while the revenues for all kinds of voice app are higher than average, the associated costs are higher too. Those developers that capture significant value with voice services are using them to add value to some other service, rather than trying to re-sell them directly. That said, these services are very easy to use and relatively inexpensive. It’s worth thinking about ways you could use them to build better relationships with the customers for your app business.

Categories
Business

Backend-as-a-Service Economics

There are a wide variety of products that can be considered Backend-as-a-Service (BaaS) offerings. At the time of writing we list 43 of them on our sector summary page. We have previously discussed whether or not they’re a good idea and how much development effort you could save by using one. In our most recent survey we asked developers about their use of some of the most popular options. By comparing developers’ use of BaaS with their average revenues and active user bases, we can determine how well these products are working for them.

BaaS, what’s BaaS?

An interesting point to note is that a lot of developers don’t appear to know what BaaS really is yet, suggesting there’s plenty of room for growth in this sector. Almost 20% of the developers in our survey who indicated they use BaaS solutions said they were using their own proprietary backend; this is just a backend service and not BaaS, since it is built in-house rather than re-using a more generic backend solution from a third party. We exclude all of these people from this analysis. Technically it’s only really BaaS if the provider hosts it for you too, although we include options like Deployd, which is an open source project that combines with a PaaS offering like Heroku to give all the features of a BaaS (and more flexibility).

[sectors slugs=’backend-as-a-service’]

Show me the money!

Developers using BaaS solutions have an above average interest in making money. Only 11% of BaaS users were not interested in money vs. 20% of non-users. This is probably because the costs of running any kind of backend service are a deterrent to hobbyists. Of the remaining developers who are interested in making money (excluding those who were unable to report their revenues, or earned over $50k per app per month) 43% of BaaS users were earning more than $500 per app per month vs. 31% of those not using BaaS. The average monthly revenue for BaaS users was $3223 vs. $2482 for non-users. So, developers are more likely to earn enough to cover the costs of running a backend if they use a BaaS and also earn more than enough extra revenue to pay for hosting/service costs on average.

More backend features = more revenue

Not all BaaS solutions have the same feature set. The more comprehensive offerings typically have user, content and data management, along with push notifications, social integration and some kind of location data support built-in; most are also able to be extended with custom code. Less complete solutions generally only offer a small subset of this feature set, with different vendors providing different subsets. Some services are well integrated with cross-platform tools (e.g. Appcelerator Cloud Services and Sencha.io) and although they are quite comprehensive, their results appear to be more influenced by the CPT itself than the use of the BaaS – that said, users of these services also make more revenue than other users of the CPT, with Sencha coming out significantly ahead of Appcelerator in both cases. Finally, Deployd and Apigee Usergrid offer more flexible/configurable options, where users can add features from a fairly comprehensive base.


As can be seen from the graph above, users of the more comprehensive BaaS offerings make significantly more revenue than other BaaS users. On average their active user bases are only about 20% larger, so it seems the more feature rich backend services are translating to higher value generated for end users.

Which features are most important

We also asked developers which features were most important to them when selecting a BaaS. The majority of users were interested in user management and data management, features available in almost all BaaS offering and thus unsurprisingly correlated with approximately average revenues. Those primarily interested in using a BaaS for push notifications or file storage had almost half the average revenues (these are fairly easy to achieve without the overheads of a BaaS, possibly indicating a lack of sophistication) while those interested in content management made about 50% more than average and those most interested in analytics more than double the average. This outperformance for developers focussed on server side analytics mirrors that on the client side, suggesting it’s the developers’ approach and not the feature itself with produces the improved results.

Categories
Business Tips

How to Optimise Ad Revenue

On the surface, advertising seems like a fairly simple and easy to implement business model for an app. Decide on some places to display ads, integrate one or more third party ad services and wait for the money to start rolling in. If you do this without a clear plan for how and why users will interact with ads in your app you’ll probably find the revenue disappointing. Optimise revenue by growing your user base, increasing engagement and improving your fill rate (how many of your possible ad slots actually show an ad) and eCPM (effective cost per thousand impressions). The challenge becomes apparent when you try to improve these metrics and find them somewhat opposed to one another. Show too many ads and users either use your app less or abandon it altogether. Make the ads smaller or display them less prominently and your click-through ratio (and hence eCPM) goes down. Show a lot of irrelevant ads (higher fill rate typically has less relevance on average) prominently and users start ignoring all of them by default. Make your ads prominent and they’d better be relevant. If it’s hard to target your audience well then keep the advertising low key and count on volume to make up the revenue. It turns out that getting the right balance is very difficult and not many developers manage it.

Higher eCPM != higher revenue

A very small fraction of developers in our survey managed to achieve truly exceptional eCPM’s, greater than $5, sometimes even more than $10. These developers were almost all making multiples of the average revenue in total but they were also using more than one revenue model. It’s likely that most of their revenue was coming from another source and they showed very few highly relevant ads to get those rates. If we focus on the developers who only used advertising as a revenue model then those with eCPM’s below $0.25 were earning significantly more on average than those with eCPM’s from $0.25-1.50. So, for the majority of developers, those with higher eCPM’s make less money. To add to the confusion, size of active user base is also very weakly correlated with ad revenue; the simple concept of getting more users to make more money from ads doesn’t work on its own either.

Why iOS developers make more with ads

A good illustration of the complexity is to compare iOS and Android developers. As reported by several ad networks, iOS gets a higher eCPM on average than Android. However, our survey data suggests that the difference is all at the very high end. If we exclude the developers with eCPMs over $5, iOS actually has a lower eCPM than Android. For those only monetizing via ads, Android developers had a 37% higher eCPM and while the iOS developers only had 20% larger user bases on average, they earned almost 75% more revenue every month. This suggests that the iOS developers were seeing very much higher engagement with their apps and thus delivering many more ad impressions.

The fallback network fallacy?

There’s some popular advice that in order to maximise ad revenue, developers should use at least two ad networks, one with a high eCPM and low fill rate and another with a lower eCPM but very high fill rate. The theory is that this ensures they get the most relevant targeted ads with the best rates when they’re available but still don’t waste the inventory by filling it with less relevant lower paying ads when they don’t get filled by the premium network. This fallback strategy sounds logical but does it work? There’s some possible support for this in the fact that developers using more than one ad network make slightly more money on average than those who only use one (and 70% of developers purely monetizing through ads only use one network). However, this seems more likely to indicate greater sophistication than successful use of the fallback strategy. The ads from the two different networks are unlikely to fit the same presentation, positioning and format within an app well. There’s some fairly strong evidence against this fallback strategy within our survey data – developers with eCPMs above $5 are excluded from the following sample and so are those earning greater than $50k per app per month in revenue due to the disproportionate effect both tiny minorities have on averages.

Note that 67% of developers using ads selected neither eCPM nor fill rate as reasons for choosing their ad networks and that percentage is mirrored in the group only using ads for monetization. Those that selected one criteria or the other but not both generated slightly higher eCPM than average and significantly higher revenues. Developers trying to maximize both metrics to squeeze the maximum possible revenue out of the advertising space in their apps generated the highest eCPM but did far worse than average on revenues.

Optimise for engagement

This data suggests that developers should pick an appropriate advertising style for their app and try to go for either quality or volume of ads displayed but not both. Considering that the most popular advertising services use a cost-per-click model, the highest eCPMs are likely to simply reflect higher click-through ratios. In many cases the taps on ads may be accidental. Ads getting in the way of the content or usage of an app result in fewer users or lower usage and thus lower revenue. It seems that by far the best way to optimise ad revenue is to build app experiences that people want to spend a lot of time using and make sure the ads don’t spoil them. The extra volume of impressions generated by tens or hundreds of thousands of engaged users will more than make up for lower eCPMs or ad inventory not getting filled.

Categories
Business

Why Measurement Matters – the case for analytics

Creating a successful app business takes a lot more than a good idea and the skills to develop an app and upload it to a store. As we’ve discussed before, developers who promote their apps are almost 3 times as likely to break-even as those who don’t. This is the simplest difference with a massive effect on success. It seems obvious, no marketing means a good chance almost no-one discovers the app and thus no revenue, yet some developers still don’t do it. Picking the most lucrative platforms seems like another obvious candidate; considering only those developers who are interested in making money, those that develop for iOS are a little less than twice as likely to be above the “app poverty line” (38% earn over $500 per app per month) than those developing for BlackBerry (20%). Getting your revenue model right can also make a significant difference; according to our survey, developers using a subscription model earn nearly 2.5 times as much as those using other revenue models on average. Not all apps can use a subscription model, however, there is something that almost every developer can do which is correlated with more than double the chance of being above the app poverty line and earning more than 2.5 times the average revenue compared to those that don’t…

Measuring user activity and crashes

You managed to build an app and get people to download it but how many of them still use it? When do they use it and how often? What devices do they have and which firmware versions? What features do they use the most? Which parts of the app should you focus on improving? Do your changes to the app make users interact with it more or less? All of these questions require measuring the user interaction with the app by recording data and analysing it. Unless your app regularly interacts with your own backend service which you can collect relevant statistics from then this would be an expensive capability to build. Fortunately there are a number of third party usage analytics services to do it for you and the two most popular, Google Analytics and Flurry, are free to use.

Similarly, no app is perfect when it is launched and it’s almost impossible to test on every device and firmware combination out there in the market. If some of your users are getting crashes that you can’t reproduce and fix quickly then you’re likely to get a lot of poor reviews, which will reduce the chances that other users download your app in the future. Unless you have tooling in place to capture details of crashes and report them to you then it’s very hard fix them. Although there are libraries that can report crashes to you directly, unless you want to analyse every single one manually, you’ll want tools that do that for you and categorise them such that the ones with common causes are grouped. Without this there’s no good way of prioritising what to fix. Again, crash analytics & bug tracking service providers can handle this for you and one of them, Crashlytics, was recently acquired by Twitter and now provides all of its features for free. Other providers also have free tiers.

This is not to suggest that the free options are the best for every app, just that there’s very little excuse for not using these tools because there are free ones. If you need convincing, take a look at this infographic, which uses our survey data for just the respondents that were interested in making money and earning less than $50k per app per month (we exclude the very small number of top earners as they can distort the stats, although in this case they would only make the argument stronger).

Correlation is not causation

It’s really important that we note a strong correlation between usage of analytics tools and increased success for developers only. Correlation is not causation. It’s clear that simply integrating these tools and doing nothing with the data is not going to make the slightest difference to anyone’s results. They are trivial to integrate but provide no direct end user benefit at all and no additional revenue stream. It could be argued that most providers only make these services available for the leading platforms and the extra success is primarily due to that. This is not the case – restricting the data set to those developers whose primary platform is Android or iOS produces an almost identical pattern of results. Another argument is that crash analytics services are typically focussed on native stack traces, which don’t often provide much diagnostic value for non-native apps. However, anyone tempted to blame a poorer non-native user experience produced by development tools that are also less likely to support these analytics tools should note that cross-platform tool users make more revenue.

One valid argument is that until you have a successful app with a fairly large and diverse user base, collecting crash data and analysing it is not the biggest problem you need to solve, those who use the services may simply be the ones already big enough to have the problem. There are two arguments against this. First, integrating crash analytics after you’ve acquired a large user base is too late; how many users will give you a second chance installing at least 2 updates to a crashy app (you can’t fix it until the update after you integrate the analytics)? Second, this doesn’t explain why those integrating both types of analytics tool have a significantly greater chance of being above the poverty line than those that only integrate one or the other. Similarly, whilst there is almost certainly an experience factor at work here it is clearly not the whole answer.

The most plausible explanation for these results is that those with a more scientific approach to their app business tend to collect as much data as they can and use it to drive decisions about their development. This produces more successful apps than intuition and guesswork. So, sign up for analytics services, integrate them with your apps and act on the data they provide. This process can’t magically turn a bad idea or unwanted app into a success but it can help make a decent app into a much better one. If you apply some of this data-based reasoning and scientific methodology to deciding what to build and how you market it too then that’s likely to further increase your chances of success.

Got an alternative explanation for this data? Let us know in the comments below.

Categories
Platforms

Kids’ Educational Apps – An Indie Dev’s Final Frontier

VM_010

I am wondering if you know that there is an SXSWedu event. Well I can’t blame you if you don’t, it is the third year it is running and it sounds a bit off when you think of SXSW and “Keep Austin weird”. If you don’t then it will even come more as a surprise to learn that Bill Gates delivered the closing keynote to a standing-only room of 2,500 people.  On top of that, Apple revealed to TechCrunch a couple of weeks ago that they have sold more than 8 million iPads to educational institutions worldwide (4.5 million to U.S. schools).

You might have started thinking that putting together an educational app may not be such a bad idea, I mean how hard can it be? How about checking out the App Store’s top 200 paid list of iPad educational apps? Just by going through it, even if you don’t know who is who, you will see a lot of indie developers. Let me save you the trouble and give you the rundown. Of the top 200, 70% are kids’ educational apps. Out of these, roughly 80% are by independent developers, and only 20% from well-known publishers like Disney, Nickelodeon, Sesame Street, etc. This is really impressive to say the least.

But before you team up with a teacher and start coding that idea, hold on. For every developer who is succeeding, there are 20 who are struggling to see noticeable sales. To make matters worse, only 20% of the developers present in 2009 were still active in 2012 (iLearn II – “An Analysis of the Education Category of Apple’s App Store”).

All of this translates to the indication that there are still great opportunities in kids’ educational apps right now, but there is also a lot of risk. That is why the kids’ educational apps market is an indie dev’s “final frontier”. So before you set off to “boldly go where no man has gone before”, here is a survivor kit to keep in mind when navigating those treacherous waters:

1)    App stores lack specific categorizations

No single app store has a separate category of kids’ educational apps. So kids’ educational apps are all scattered in a number of categories. In the Apple App Store they are scattered across Education, Games/Educational, Games/Kids, Books, etc., and in the Windows Phone Marketplace between Education and Kids + Family. Keep that in mind as you pick your category and since there is no right or wrong,  don’t be afraid to experiment.

2)    Never ever forget market segmentation

It is an easy assumption to make but it is one that you must always keep in mind. Education differs across countries considerably, it is not only the language and cultural barriers, but also that educational topics are approached in different angles. In the US the past three years the Common Core Standards initiative has been put together that provides a clear understanding of what students are expected to learn so teachers and parents now what to do to help them. CCS can be a very useful roadmap when you are thinking of your app. Lastly always factor in that localization will not be easy and it will cost more than it would normally do.

3)    You have limitations on your monetization strategy

With stories of a 5 year old spending $2.500 on iPad apps in 10 minutes hitting the news frequently be very careful of your monetization strategy. I am not arguing to exclude In App Purchases but be very cautious about your implementation and disclose this information to parents.

4)    Be wary of COPPA

Talking about disclosures you need to get up to speed with the Children’s Online Privacy Protection Act. You need to have a privacy policy, provide disclosure about data practices and take responsibility for data practices of 3rd party code. Lorraine of Moms With Apps has put together a great reading list on the subject here, which is always updated.

If then you are up to being one of the risk-takers that Bill Gates mentioned in his speech, help change the face of education and make money on the way keep in mind his closing words “In this space, we either improve the quality of education or we stay flat, like we have for the last few decades”, put your soul into it and make great educational apps.

Categories
Business

How Much Is An Active User Worth?

App store analytics providers have been telling us that almost all of the growth in app revenues in the last year has been through in-app purchases. However is that just because the model has become more popular? Or because revenue has been concentrating at the top of the market where the strategy is very popular (particularly in free-to-play games)? Probably a bit of both but it’s also the case that subscriptions and in-app purchase do produce the highest overall revenues. If you exclude the developers of top apps (anyone earning over $50k per app per month on average and with over 500k active users) then it turns out that aside from apps that provide enough value to justify a subscription model, the important thing is acquiring users and keeping them engaged. The average revenue for an active user is fairly constant, regardless of the monetization method.

How much do you think is an active user worth? Take the Developer Economics Survey and have your say!

For the purposes of our survey, freemium could be a limited free app with a separate paid version promoted by the free one, or a free app with a premium upgrade via in-app purchase. In-app purchases can be any content, features or virtual goods purchased in the app, which itself can be paid or free. Paid downloads, advertising and subscriptions are hopefully self-explanatory. Note that it’s possible (and indeed quite common) for developers to use multiple revenue models, either on separate apps or within the same app – e.g. freemium with advertising in the free version. The average number of revenue models per developer in the sample above was 1.7. However, if we only look at developers using a single revenue model, the pattern is very similar (and average revenues are lower across the board).

Make the core functionality free if you can

For the majority of developers, an active user is worth around $0.04 per month. All other things being equal, unless you have a sufficient reputation or well known brand association that you can get paid downloads in large numbers, then it’s better to avoid the user having to pay directly for the core functionality of your app. This results in more downloads and a larger user base. Freemium comes out badly here, it seems that the free trial may get lots of downloads but overall slightly fewer active users (and paying users) than a straight paid download. Advertising and in-app purchases had almost identical user bases and overall revenue. Subscription apps had the smallest active user bases but by far the greatest revenue, however, this revenue model requires some kind of ongoing service that is external to the app, which will have associated costs.

In-app purchase beats advertising at the top end

The picture is a little different if you include the highest earning apps. At this point paid downloads fall far behind, both in terms of ARPU and overall user base and revenues. This is not to say you can’t have a very high grossing app with a pure paid download approach (Minecraft is a great counter-example), just that the probability of doing so is much lower. Subscriptions still come out on top but not by so much. The lower ARPU for subscriptions at this level suggests that the top subscription apps have a very popular free tier. Freemium does slightly better than paid downloads for active user base size and significantly better for revenues, suggesting that top quality paid apps with a higher price may sell better with a free trial of some kind. Finally, in-app purchases and advertising both generate the largest active user bases by offering their core functionality for free but a well designed in-app purchase scheme beats advertising for monetization by some distance.

Beware service costs eating all your revenue

In addition to revenue model selection there are also implications here for apps which connect to backend services. The average monthly revenue from an active user needs to exceed the costs of providing the service significantly to make a profit. If the majority of developers are only making $0.04 per user every month on average then say a Kinvey (purely because they price per user for iOS and Android, making the comparison easy) BaaS at $0.03 per user (for 200-5000 users at current pricing) does not leave much for the developer.


In-app purchases or ads?  Take the Developer Economics Survey and have your say! You may win awesome new gear.

Categories
Business

How Many Users Is Realistic?

One of the most common mistakes developers make when planning the business case for a new app is dramatically overestimating the number of users they will be able to attract, particularly for their first app. The typical argument goes something like this: “My app will be compatible with 400 million devices, if I can reach just 1% of those, that’s 4 million users”. The trap here is that 1% sounds like a very conservative fraction of the installed base to target but in reality it is incredibly high. Of the 664 respondents in our latest survey who integrate user analytics and provided us with their information about the active user base for their most popular app, only 6% had over 500,000 users. The nature of store charts and limited promotional space means that those who break the half million user barrier are quite likely to gain many, many more users than that, however, what’s a realistic figure for everyone else?

One of the more interesting findings we published was that, excluding those with more than 500,000 users, the mean average active user base for iOS developers was 70,000 users vs. 51,000 users on average for Android. The median user base, is 27,500 users for iOS and 15,500 for Android. The percentage difference between means is much smaller than that between medians, suggesting that the distribution of active user bases in general is worth further investigation.

As can be seen from the chart above, 200,000 – 500,000 users is the least common user base size, despite being twice as large an interval as the 50,000 – 200,000 option immediately below it. This suggests that there is a threshold level somewhere near 200,000 users, such that if you break that level you’re likely to “get noticed” and end up with significantly more users. There’s a similar bump near the bottom end of the scale where 501 – 2,000 users is more commonly reported than 2,001 – 5,000 users. This is likely to reflect the difference between apps which are not (effectively) marketed and those that are.

In addition to the platform differences noted above, there are also interesting differences in user base size by revenue model and app category. For example, apps using advertising as a revenue model (and therefore presumably free downloads) are more likely to gain over 50,000 users than other models, whilst freemium shows a very similar distribution to paid downloads. The games category is incredibly competitive and developers there are less likely to have more than 50,000 users, whilst developers in the music and video category had the highest probability of breaking both the 50,000 and 500,000 user barriers. The combinations of revenue models and categories are almost endless but the chart above has dynamic filters so you can explore the opportunities in your own app category. Please let us know about anything interesting you find in the comments below.