Categories
Community Languages News and Resources

[Infographic] The most global developer survey

The new Developer Economics Infographic is out! The most global developer survey so far has reached over 16,500 developers from 145 countries. Have a look at the findings and let us know where you stand in the global ecosystem. Bonus: hear it from our survey prize winners!

Developer Survey: Developer Economics Q2 2016

global-dev-survey (1)

Interested in more findings? Check out our more recent reports, here.

Categories
News and Resources Platforms

The Three Waves Of Mobile Marketing

With over one million apps in the Apple and Google stores, you‘d think that app development has become business as usual. As we enter 2014, the making of apps is a sought-after commodity. But [tweetable]the marketing of apps remains part art, part science[/tweetable].

shutterstock_114890851

App marketing and advertising took off early in the history of the app economy. The freemium model (generally speaking, apps that are free but monetize through premium upgrades, in-app purchase items or advertising), took place a couple years after. On the App Store, in-app purchase items (IAPs) were only introduced as of late 2009. On the Google Play Store, they had to wait until 2011.

Since the freemium app model started making a name for itself, the parameters and requirements of app advertising and user acquisition have been in constant evolution, strongly influenced by transformations of the app ecosystems. In particular, app publishers, marketers and other stakeholders have constantly needed to adapt to the evolving policies and barriers enforced by Apple and Google.

In fair consideration, many of the steps the two companies took were also in reaction to the evolution of advertising techniques and practices within their ecosystem. The dynamic is therefore mutual.

Looking back on the brief history of app marketing, there are three main phases or “waves” of app marketing, presented in the table below. Each phases has distinguishing features in terms of business objectives, marketing strategies and practices, technology focus, transparency standards, platform regulations etc.

The three waves of mobile app marketing:

1st wave 2nd wave 3rd wave
Timeframe 2009 – 2011 2012 – present 2013 – present
Goal Volume through top chart position Volume with a focus on the price of installs Volume with a focus on the quality of installs
Marketing strategy Incentivized Downloads Shift to quality: Non-incent ROI-positive media buying
Pricing Methods
  • Flat fee
  • Cost Per Click
  • CPM
Cost Per Install
  • Cost Per Action
  • Cost per Reengagement
  • adjusted CPI (aCPI)
Technology focus None
  • Install attribution tracking
  • In-app analytics
  • Post-install, in-app event tracking
  • Programmatic buying
  • Deep linking
  • (Cross-device) Retargeting
Tracking technology
  • iTunes Connect
  • UDID matching
  • MAC Address
  • openUDID
  • Fingerprinting
  • Platform-specific device identifier (IDFA, Advertiser ID)
  • Social Media login
Level of platform regulation and transparency Low Medium High
Market dynamics Emergence of new “pure” players Growth, stronger positioning of existing players Consolidation, M&A activity, older players start getting involved
Advertising formats Banners, editorial advertising, incentivized Interstitials, video ads Native ads

I’ll discuss these three waves along their most important characteristics.

The first wave: the early days, focus on volume

The early days of app marketing date back to 2009. They were characterized by the emergence of the Apple App Store as the main platform for user acquisition. [tweetable]Publishers mostly relied on the top chart rankings to gain visibility[/tweetable]. This led many of them to resort to the so-called burst campaigns, either incentivized or natural such as editorial app “boosters” and blogs. These campaigns generated large amounts of downloads in a short period of time in order to climb the app store rankings.

In this context, performance models, whereby advertisers only pay for the installs generated, mostly served for incentivized campaigns, and burst campaigns were often sold on a flat-fee basis. For the burst campaigns run on a Cost Per Install (CPI) basis, downloads were accounted for using iTunes Connect data or at best UDID matching. Consequently, there was neither technology focus nor need in terms of tracking. In short, user acquisition was not data-driven.

During that time, many pure players, such as Tapjoy, Flurry, or AppGratis, entered the space, as it was a land grab with low barriers to entry. Platform regulations were still relatively lenient, as the tenants of the ecosystems didn’t wish to curtail their growth. For instance, incentivized downloads were still allowed by Apple until April 2011.

The second wave: focus on quality and performance tracking

The second wave of app marketing started around 2012. The volume remained the main marketing objective, but CPI-based campaigns gained momentum and performance marketing started becoming widespread. More generally, a discrete shift towards more quality tracking in advertising campaigns was taking place.

In terms of regulation, Apple tightened its grip on a fast-growing ecosystem and cracked down on players accused of taking advantage of the top chart ranking algorithm. In April 2011, incentivized downloads were banned and in October 2012, Apple enacted clause 2.25, forbidding “Apps that display Apps other than your own for purchase or promotion in a manner similar to or confusing with the App Store”. This led to the ban of several of app discovery services, the most famous being App Gratis which was pulled from the Apple’s store in March 2013. App publishers themselves suffered the consequences of these restrictions, such as Animoca who, in January 2012, saw all their apps removed by Apple under the allegation that they were using bot farms to generate fake downloads.

Technology-wise, the growing popularity of performance marketing encouraged the rise of efficient attribution tracking solutions, in order for advertisers to trace downloads down to their respective sources. Among the tracking technologies which then emerged, the most popular are fingerprinting as well as single, platform-specific device identifiers (Google’s Advertiser ID and Apple’s Identifier For Advertisers – IDFA). As of today, [tweetable]fingerprinting remains the only legitimate solution enabling mobile web tracking[/tweetable].

Publishers also started becoming more data driven by integrating in-app analytics solutions such as Localytics to analyze usage, retention, engagement, virality and monetization metrics. Similarly, a focus grew on measuring the quality of the users through the estimation of customer lifetime value (LTV). However, this was at this time mostly performed to understand the user journey and improve the user experience, not yet (so much) to optimize user acquisition campaigns. In other words, [tweetable]performance stopped at the install, as in-app and attribution tracking remained distinct from each other[/tweetable].

In terms of market dynamics, the wave of new entrants stalled as existing advertising players consolidated their positions and stronger regulations prevented the use of shadier advertising tactics. The second wave was pioneered by ad networks (inmobi, AdMob, Leadbolt), affiliate and cross-promotion networks (AppFlood, Chartboost, AppLift), mobile agencies (Fiksu, Somo Global).

The third wave: focus on lifetime value and ROI

The third wave of app marketing started in 2013, is currently unfolding and will probably define the mobile landscape for at least the next two years. This third wave is distinguished by a massive shift towards quality, with, in particular, the growing realization by mobile advertisers that acquiring users, even at a low price, makes no sense if these users are not retained, engaged and finally monetized.

This global shift to quality has generally been embraced by advertising companies, app publishers and platforms alike, all with various consequences.

First, platforms themselves are taking on and driving the trend, and introducing heightened regulation. In 2013, Apple modified its ranking algorithm to take into account more in-app, post-install qualitative factors such as retention and engagement metrics. Google, too, started enforcing harder restrictions on its developer policies when it banned spammy user acquisition techniques such as push notifications or icon drops on the Play Store.

Naturally, it is app publishers and advertisers that are driving the largest part of the shift. Indeed, increased competition as well as rising CPI prices has made it an impediment to track and optimize user acquisition campaigns more accurately, and to allocate marketing budgets towards the best-performing channels. Technically, this means tracking post-install events, connecting them to the acquisition source, and finally linking attribution tracking to in-app metrics.

Early assessment of the LTV of acquired users now enables advertisers to quickly assess the quality of the various acquisition channels used. This in turn allows them to optimize and fine-tune the campaigns by allocating budgets to the traffic channels offering the highest user quality (users whose LTV is higher than their cost of acquisition – CPI).

On the whole, if the first wave focused on volume only and the second on price-weighted volume, the third wave is characterized by quality-filtered volume.

In the wake of this quality shift, new pricing schemes appeared: for instance, [tweetable]Cost Per Engagement (CPE) now allows advertisers to pay for actions taking place after the install[/tweetable], such as game tutorial completions, or first purchase.

More quality and more regulation also go along more trust and transparency. In the specific context of the relationship between advertisers and user acquisition networks and other partners, this means that networks have been more willing to share information about their traffic sources, while advertisers have been less reluctant to share more in-app data about the users generated.

In terms of market dynamics, the third wave is characterized by increased M&A acquisitions as older, established digital and online companies start acquiring pure mobile players. This way, in 2013 we saw, among others, retargeting company Criteo buy out mobile tracking company AD-X, Twitter snap up mobile ad exchange MoPub and, in gaming, Japanese telecoms firm Softbank together with GungHo acquire Finnish mobile game publisher Supercell. There were also a couple of mobile-only deals, such as the acquisition of Jumptap by Millennial Media or the merger of mobile gaming services company Playhaven with mobile analytics provider Kontagent.

As the third wave of app marketing is still forming, other data-driven approaches are emerging, such as real time bidding, retargeting and cross-device targeting. Reactivation and re-engagement campaign techniques are already taking into account quality factors and focusing on post-install events.

For developers, it can be of great help to keep this history of paid mobile user acquisition in the rear-view mirror as they strive to understand and adapt to its new challenges.

– Thomas

[Thomas heads up content marketing at AppLift, loves scrutinizing the developments of the mobile industry and collects photo apps on his iPhone the rest of the time. He can be contacted at tso@applift.com]

Categories
News and Resources

India – your next apportunity?

The world is getting ‘App’ified – and India is entering the fray at full force! Apps are an important element of consumer mobile behaviour – share of time spent on voice calls and texting is reducing, while time spent on apps and internet browsing is rising. With India rapidly growing as a major app superpower, it is important to understand the underlying drivers of this rapidly growing ecosystem.

Is there an “apportunity” for your app in India?

The Rise of India as an App Superpower

If you are creating an app in a localised language, you should also read The App Localisation Opportunity.

Categories
News and Resources

Tablets go mainstream, TV apps still niche

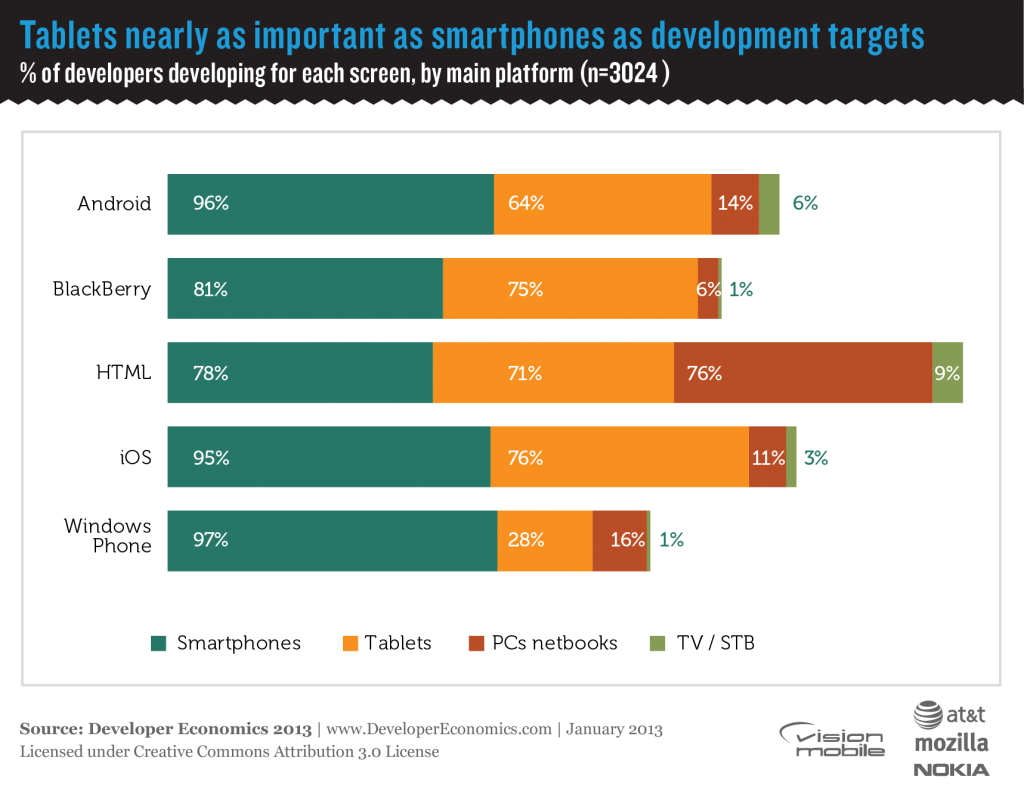
In our latest developer survey we asked developers about the different screens they target. The results show smartphones are the most popular target, whilst tablets are catching up fast. PCs are most commonly targeted by web developers while TVs are still a niche app market for all developers.

TV development

The majority (86%) of 3,460 developers in our survey develop on smartphones, while a large share of them also develop on tablets, led by iOS developers (76%) indicating the attractiveness of the iPad as a development and monetisation platform. Despite the rise in Android tablet share during 2012, we did not observe a significant increase in the share of Android developers targeting tablets (64% vs. 62% in our Q1 2012 survey) although we believe this is likely to change in the near future.

HTML developers take a more platform-agnostic approach, as they develop across smartphones, tablets and PCs almost equally, according to our survey, a testament to the use of HTML as cross-screen app development technology. At the same time, HTML limitations, such as lack of support for native APIs, tooling and device optimizations, prevent it from becoming a swiss-army knife for cross-platform development.

TV development remains niche, at the same levels reported in Developer Economics 2012, as the hype cycle around the “Smart TV” experience is yet at a very early stage. This seems in line with findings from research firm NPD, who reports that only 15% of HD TVs are connected to the internet (directly or via a set-top box), limiting their appeal to app developers. Additionally, only a small fraction of those connected TVs use apps for anything other than streaming video or music services. There is a much faster growing trend for the TV screen to be used via smartphone or tablet apps “throwing” content to it.
[doritos_report location=’DE13 Article – Targeting Screens’]

Categories
News and Resources

The user analytics duopoly: Google and Flurry are well ahead of competition

Usage analytics tools usually have a very simple integration which enables developer to get basic information about their active user base – size, usage frequency, device models, OS versions and app versions in use. More custom integration enables developers to log events to the usage analytics platforms when users perform specific actions within the app. This allows developers to track which features or functions are most use, measure conversion rates and pinpoint where in UI flows users are giving up if actions are not being completed.

User analytics services gain in importance as competition intensifies

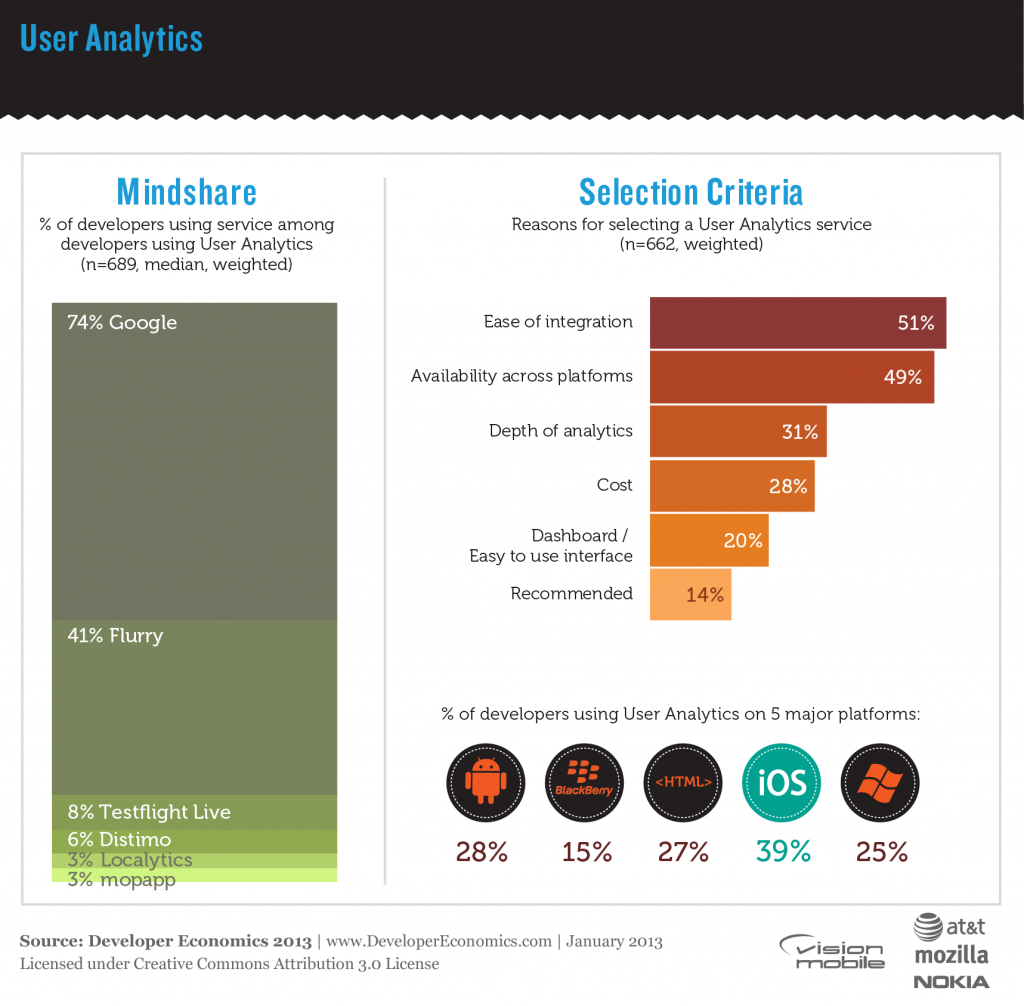
User analytics services are becoming increasingly important as competition in app development continues to rise. The ability to track how users interact with apps is extremely valuable for both developers and product managers and to some extent acts as a proxy for user feedback. The absence of a direct two-way communication channel between developers and users means that user analytics often provide the only channel from user to developer. 28% of developers use user analytics services overall, but usage rises with the number of apps developed, reaching 39% among developers working on more than 10 apps per year.

Analytics services seem to be significantly more important among iOS developers (used by 39% of iOS developers) compared to other platforms. This suggests that iOS developers take more interest overall in their user base, a fact that could indicate a more professional approach to development. Among the top platforms, user analytics tools are the least popular with BlackBerry developers (15%). BlackBerry has suffered high churn of its affluent user base and developers sticking with the platform are likely to be working on outsourced ports with little interest about the way that users interact with an app. Among the other major platforms around a quarter of developers use user analytics, with Android being slightly ahead (28% of Android developers).

DE13-19-01

Google and Flurry lead the pack

The picture in user analytics services is quite telling with two services dominating: Google and Flurry. Google has traditionally been strong in web analytics but it has now extended its stronghold on to mobile platforms commanding a 69% mindshare among developers employing User Analytics services. However, its dominance is mainly observed among HTML developers and although it leads on Android, BlackBerry and Windows Phone, its lead is by a small margin. Runner-up Flurry, is used by 49% of developers employing User Analytics services but is the leading User Analytics service on iOS (64% vs. 58% for Google). Flurry, being one of the pioneers in User Analytics has grown into one of the heavyweights in app ecosystems, and is recognised as a de-facto analytics platform for developers. Beyond these two services, there are numerous smaller players vying for third place, currently held by Testflight Live, a service recently acquired by ad mediation service Burstly in a move that is quite typical of the synergies between different tools and services that drive consolidation in the marketplace.

User Analytics services are stronger in Media apps (News/sports/weather/magazines) as well as in Entertainment apps, used by 36% of developers working on such apps. However, they are more or less popular across all app categories, but less so in Education/Reference apps. Google analytics is stronger overall across all these categories, with the exception of Games where both Google and Flurry are equally strong.

Minimizing overhead is the priority

Developers opt for services that are easy to integrate within their apps or that are available across several platforms as indicated by 51% and 49% of developers using user analytics services. I.e. the main priority for developers is to minimise the overheads associated with using user analytics, while optimising analytics comes third: only 31% of developers using user analytics services are concerned with the depth of analytics, and only 13% are interested in real-time reports. Cost is a also deciding factor as pointed out by 28% of developers employing user analytics.

We asked developers using User Analytics services to indicate the number of active users of their most popular app. Excluding those apps that have more than 500,000 users, developers’ most popular apps have an average active user base of 56,000 users, although this number varies widely within platforms and across platforms. iOS developers indicated 70,000 users vs. 51,000 users on average for Android. The median user base, is 27,500 users for iOS and 15,500 for Android, indicating that while Android commands a higher market share, iOS users engage more actively with the platform when it comes to apps with less than 500,000 active users.

[doritos_report location=’DE13 Article – User analytics’]

Which user analytics tools are other developers using?


[toggle title=”Important things to know about this interactive graph”]

  • All the filters in the graph refer to survey questions in which respondents could select multiple answers. This means that there is no direct link between the filter and the use of the tool. For example, filtering on “Android” means that the respondents develop Android apps. It doesn’t imply that they use the tools for their Android apps specifically, or even that the tool supports the Android platform. Use filters as a guideline only.
  • Keep an eye on the sample size. If the sample size is low, the graph doesn’t offer strong conclusions about the popularity of different tools. Use your good judgment when making decisions.[/toggle]

    Find the best analytics tool for you!

    [sectors ids=’40’]

Categories
Business News and Resources

Two Important App Market Trends to Watch in 2013

2012 was another big growth year for the app market. Apple continued to launch new products, sell them in ever greater volumes and distribute more revenue to developers. Meanwhile Google overhauled their market and developer revenues climbed sharply. Android developers also saw the Amazon Appstore expand and become a serious second revenue source. Developers who created quality apps and marketed them well were richly rewarded. However, for many developers the major challenge of getting their apps discovered by users only got worse. How is 2013 likely to compare and what are the most recent app market trends? Will app revenues continue to grow at similar rates and will those revenues keep concentrating in the hands of fewer publishers?

App market trends: Continued Growth

According to Distimo’s 2012 report, Apple’s daily App Store revenue grew 21% in the four months to the end of November. Google Play revenue grew 43% in the same period. During November the average daily revenue from the App Store was $15m while for Google Play it was $3.5m. So Google has more than double the growth rate, although from a much lower base.

The graph below extrapolates those four month growth rates exponentially through 2013. This illustrates the effects if those growth rates continued – this is not a prediction.

The Apple daily revenues and growth rate figures were taken during a double new product introduction spike, so the actual 2013 growth is likely to be significantly lower. According to App Annie, iOS revenue growth for the first 10 months of 2012 was only 12.9% total.

Similarly Android’s revenue growth in 2012 was from a very low base, it will be important to watch how it changes as the absolute revenue levels increase. The likelihood is that Android revenues will be significantly closer to iOS revenues by the end of 2013 but iOS revenues much closer to where they are now than the graph above suggests.

In the biggest spending app markets around the world, smartphone penetration is above 50%. A large proportion of smartphone purchases in those markets in 2013 will therefore be replacement devices running the same platform. With iOS a new device can download purchased content and restore in-app purchases at no extra cost. On Android it’s entirely up to the developer whether existing purchases can be used on a new device but by default, paid apps can be downloaded to new devices and in-app purchases will not be restored automatically without charge.

App revenue expectations

Will users continue to spend on apps at the same rate on replacement devices, or will the app revenues in the most developed markets start to fall? There’s likely to be some variation here across platforms and app categories but this may be the first year that the total market growth doesn’t obscure this important user behaviour trend.

App market trends: Revenue Distribution

Although the app stores are generating millions of dollars in revenues every day, those are not distributed at all evenly amongst developers. Canalys recently highlighted that 50% of revenues are earned by just 25 publishers in the US. Although we already pointed out that this is not as bad as it sounds, since those publishers have well over 1000 apps between them, at the very top, the concentration really is that extreme and getting worse.

According to the 2012 report from Distimo linked above, 7 apps were responsible for 10% of revenues on the iPhone in November, for the iPad it was only 6 apps and on Google Play just 4. At the very top on iOS we know that Supercell were grossing $500k per day from two games in early October. At the time Hay Day, the lower ranked of the two, was below position 20 in the top grossing chart, while it is now rarely outside the top 10. Clash of Clans has consistently been in the top 2 since that report. We can guess their revenue is even higher now and that the number 1 grossing spot is worth somewhere around $300-450k per day (about 2-3% of total iOS revenues) before Apple’s 30% cut.

In January 2012 the top 11 apps for the iPhone were responsible for 10% of revenues while on the iPad it was 8 apps. It’s tempting to speculate that the greater increase in revenue concentration on the iPhone is due to the changes to the App Store in iOS 6. However there is very little overlap between the top 10 grossing apps and the top 10 paid or free downloads. Whatever the reasons for this increased concentration of revenue at the top, this is an important trend to watch in 2013.

If revenues aren’t more evenly distributed amongst a larger number of developers then investment in new app projects must eventually start to decline. Otherwise, developers will need to find more business models that aren’t dependent on direct monetisation of their apps through stores.

If you are interested in more recent trends, have a look into our App Developer Trends from Q1 2015.

Categories
News and Resources Platforms

Appsfire Infographic illustrates once more difficulty to get to the top

Appsfire Infographic shared figures for the iOS App Store in 2012.

  • The growth in the amount of apps, while still high, seems to be slowing. This might indicate that the market is maturing.
  • Only 1 in 10 apps gets any reasonable traction at all. Only 1 in 1000 manages to get to the top 10 of the App Store. For non-games, only 1 in 1690 reaches the top.
  • The percentage of paid apps has dropped dramatically.